The Cowen Institute has conducted annual polls on perceptions of public education in New Orleans since 2007.
Brief 1 2024-2025: Parents and Guardians’ Opinions on K-12 Public Education in New Orleans
Executive Summary
The Cowen Institute has conducted annual polls on perceptions of public education in New Orleans since 2007. Our polls provide insights into how parents and guardians view New Orleans’ uniquely decentralized K-12 public education system. Each year, we ask between 30 to 40 questions of parents and guardians. Some of these questions are new and address the most pressing issues facing educators and families, while others are recurring, included each year to track changes in opinions on a few key topics over time.
We release the poll findings in a series of two briefs, shortly after collecting the responses. This is the first of two briefs to be released on the 2024-2025 poll, which is based on polling conducted in the fall of 2024. We present the data in this way to make it more accessible and understandable for the general public — the briefs allow us to group the findings by topic to surface trends about the public education system. This brief covers the following issues:
- The overall direction of the city of New Orleans
- The major concerns facing the city
- New Orleans Public Schools (NOLA-PS)
- The best aspects of public education in New Orleans
- The biggest areas of concern in public education in New Orleans
- Charter schools
- Performance of the schools where parents and guardians sent their children
- NCAP or the New Orleans Common Application Process
- The Orleans Public School Board (OPSB) and the upcoming elections for the Board
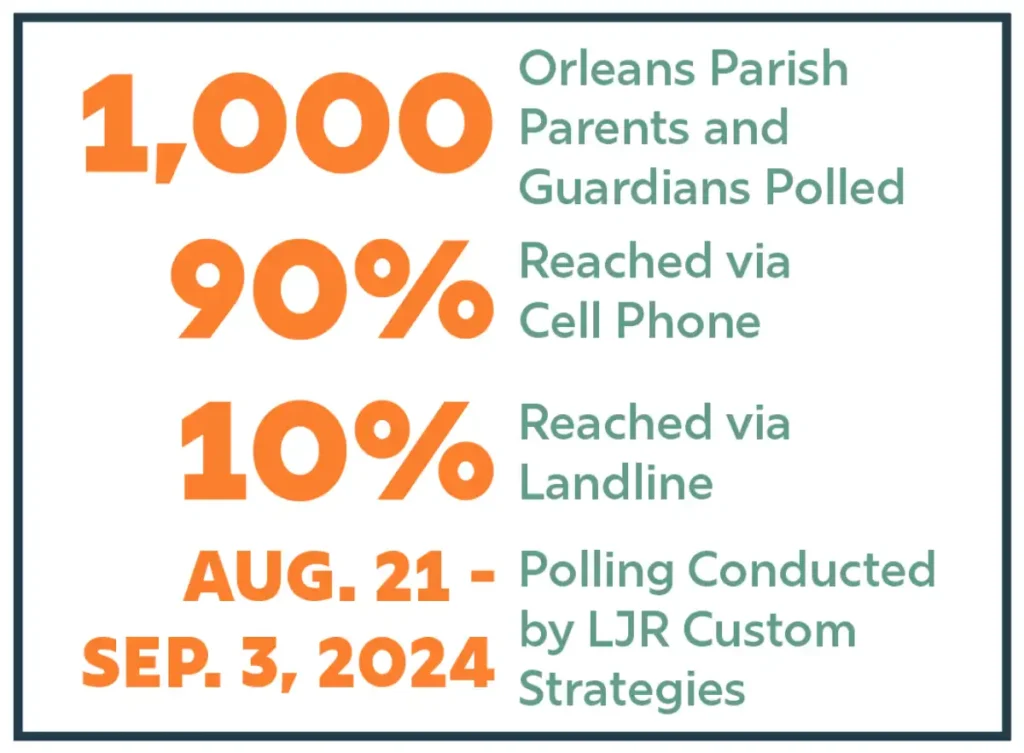
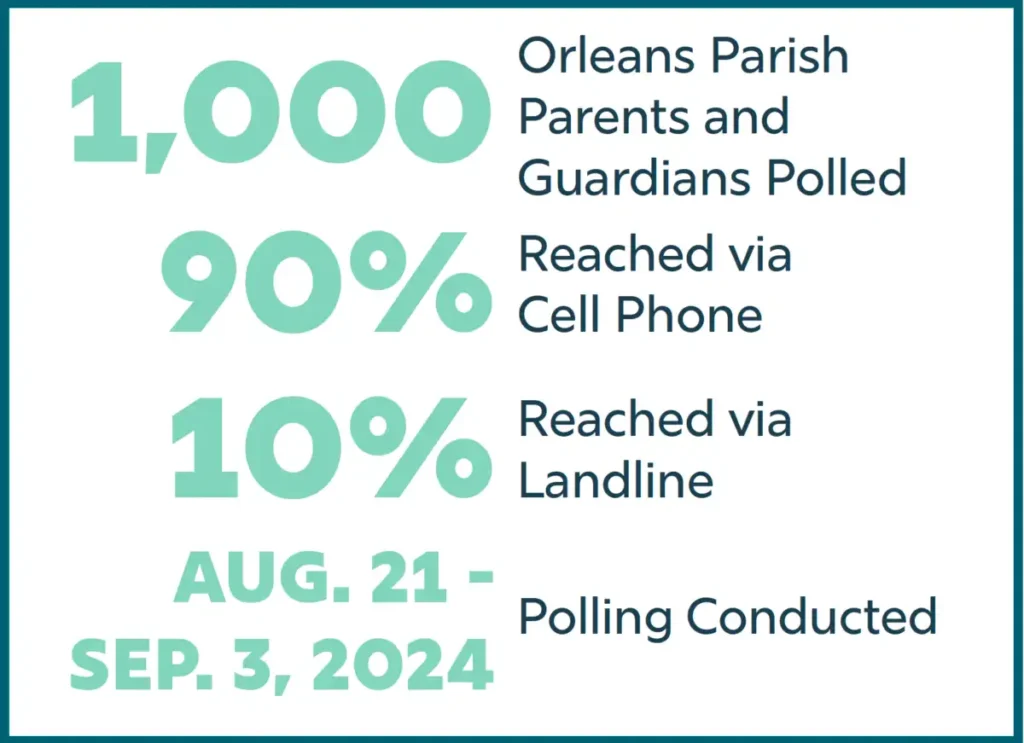
As we have done since 2020, we polled 1,000 public and private school parents and guardians in Orleans Parish, as well as a small number who homeschool their children, to capture the experiences and attitudes of a wide range of parents.
Methodology
This is the 15th opinion poll on public education in New Orleans published by the Cowen Institute since 2007. The survey items were developed by the Cowen Institute in consultation with LJR Custom Strategies, a strategic research and consulting firm led by Principal Jennifer Johnson. LJR has led our polling over the past six years. Questions were created by the Cowen Institute in partnership with LJR and feedback from external stakeholders in the New Orleans education community.
This was a survey of 1,000 adults who reside in Orleans Parish and are the parent, guardian, or the responsible party for one or more children who currently reside in their household and attend a K through 12 school or are homeschooled. The poll was conducted from August 21, 2024 to September 3, 2024 via landline and cell phone — 90% of respondents were reached by cell phone. Findings applying to the 1,000 person sample are subject to a sampling error of plus or minus 3.1%; subgroups of the sample are subject to error of up to plus or minus 10%. Additionally, please note that when percentages in responses do not add up to 100%, it’s due to rounding.
Demographics


Key Findings
Direction of the City
How satisfied are you with the direction of the City of New Orleans under its current leadership. Are you very satisfied, somewhat satisfied, not very satisfied, or not satisfied at all?
When asked to assess their satisfaction with the direction of New Orleans as a whole under its current leadership, respondents were slightly more positive than in 2023, but still split overall.
Overall, 51% were very or somewhat satisfied, while 48% were very or somewhat dissatisfied. This nearly flipped the numbers from last year when 46% were satisfied and 52% dissatisfied. Notably, satisfaction with the city closely mirrored satisfaction with public education overall — respondents who gave NOLA-PS an A or B grade, were far more likely to be satisfied with the direction of the city (85%), while those who gave it a D or F grade were more dissatisfied with the city’s direction (86%).
Subgroup Breakdown
Age: Younger parents were far more satisfied with the city’s direction than those aged 45+ and particularly those aged 55+: 70% of 18-34 year olds were satisfied, compared to 34% of respondents aged 55 or older.
Educational Attainment: The educational background of respondents also closely tracked to their satisfaction level: 63% of college graduates said they were satisfied with the city’s direction, compared to 41% of respondents with a high school degree or less.
Race: Black (53%) and White (49%) respondents expressed far higher rates of dissatisfaction than Hispanic (34%) and other race respondents (26%).
Socioeconomic Status: There were marked differences in perceptions about the direction of the city based on socioeconomic status: Parents and guardians from lower income backgrounds expressed notably less satisfaction with the direction of the city than those with higher income. 49% of respondents with household incomes above $75,000 annually were satisfied with the city’s direction and 49% were not satisfied, while 38% respondents with incomes under $40,000 were satisfied and 62% were not.


Issues Facing the City
Which one of the following issues facing New Orleans concerns you the most — The economy and jobs; education; poverty; crime and violence; infrastructure like roads, drainage, and the sewer and water system; housing and insurance costs; climate change and extreme weather; other?
When asked about the key issues facing New Orleans, “crime and violence” were the top concerns of 41% of respondents this year. Poverty (16%) and the economy/jobs (16%) tied for second, while education ranked fourth (14%). This was the lowest percentage of respondents who named education as the top concern since 2020 — though this does necessarily mean respondents believe education has improved.
Subgroup Breakdown
Educational Attainment: Respondents with higher levels of educational attainment were less likely to name crime and violence as their top concern compared to respondents with less educational attainment: 49% of respondents with a high school degree or less named crime and violence as their top concern, which was almost double the 25% of respondents with a college degree or greater.
Socioeconomic Status: Concern about crime and violence declined sharply as the income of respondents increased, while concern about education rose along with income. Crime and violence was named as the top concern by 56% of respondents with household incomes under $40,000, compared to 24% of respondents with incomes above $75,000; 11% of lower income respondents ranked education as their top concern, contrasted with 17% of higher income respondents.
Race: Black (43%) and White (47%) respondents named crime and violence as their top concern at far higher rates than Hispanic (30%) and other races (12%). The economy and jobs (20%), along with education (19%), were ranked as the top concerns for Hispanic respondents at higher rates than Black (17%, 13%) and White (14%,14%) respondents.


NOLA Public Schools
Favorability
Please tell me whether you rate your feelings toward New Orleans Public Schools as very positive, somewhat positive, neutral, somewhat negative, or very negative.
Sentiments towards New Orleans Public Schools, the entity that oversees and authorizes the majority of public charter schools in the city, shifted from last year. While the positive ratings toward NOLA-PS remained similar to last year (31% very or somewhat positive in 2024, compared to 29% in 2023), the negative ratings dropped by half (21% very or somewhat negative in 2024, compared to 42% in 2023). Additionally, more parents offered neutral ratings this year (48% neutral in 2024 versus 29% in 2023).
Subgroup Breakdown
Age: Younger parents were more likely to have positive impressions of NOLA-PS, with 41% expressing positive feelings. All other age groups had far lower positive ratings.
NCAP: Parents and guardians who had not filled out an NCAP were far more likely to be neutral about NOLA-PS (73%) than parents who had (42%). Parents with students in 6th grade or higher were more positive toward NOLA-PS than parents with kindergarten through 5th grade students.
NOLA-PS Student: Respondents without a child in a NOLA-PS school were more negative than parents who had at least one child in a NOLA-PS school, though not by wide margins. 30% of respondents without a child in a NOLA-PS school had negative views, compared to 19% with at least one NOLA-PS student.
Race: Black and White parents and guardians had similar responses to the question, while Hispanic and other race respondents were more than twice as likely to have positive ratings for NOLA-PS.
Socioeconomic status: Respondents with higher levels of household income ($75,000 or higher) were nearly twice as likely as those from lower income households ($40,000 or less) to have negative views of NOLA-PS — 38% to 21%, respectively.
Student Grade-Level: Parents and guardians with children in sixth grade or higher were more positive towards NOLA-PS than parents with kindergarten through fifth grade students.


Progress of Education
Would you say public education in New Orleans is getting better, getting worse, or staying about the same?
In 2024, respondents expressed higher levels of optimism about the direction of public education in New Orleans than in 2023. Last year, more parents thought public education in New Orleans was getting worse than getting better. This year, respondents were split evenly at 31% better (23% in 2023), 31% worse (42% in 2023), and 35% who felt it was staying the same (30% in 2023).
Subgroup Breakdown
Age: Parents and guardians with younger students (in grade five or lower) had more negative views than those with children in grades six or above.
Educational Attainment: Parents with greater educational attainment had more positive views of public education than those with less. College graduates had responses of 38% better, 10% worse, 47% the same, which compared to 21% better, 43% worse, and 33% for the responses from those with a high school degree or less.
NOLA-PS Student: Generally, non-NOLA-PS parents (45% the same, 27% worse, 21% better) offered lower scores than parents and guardians who had a student in a NOLA-PS school (33% the same, 32% worse, 33% better).
Race: The percentage of respondents saying public education was staying the same was fairly consistent across all races (between 30% to 39%), but White (36%) and Black (36%) respondents were nearly four times as likely to say public education was getting worse than Hispanic (10%) respondents. A majority of Hispanic respondents (50%) said public education was getting better.
Socioeconomic Status: Respondents from higher income households were far more likely to have positive views about the direction of public education than those from lower income households. In fact, a majority of lower income household respondents said schools were getting worse. The responses for those with household incomes above $75,000 were 21% better, 17% worse, 59% the same, compared to 14% better, 50% worse, 32% the same for those from households with income under $40,000.


Education Quality
What grade would you give the overall quality of education offered by the public schools in New Orleans – A, B, C, D, or F?
One of the questions we’ve asked almost every year we’ve conducted the poll is for parents to grade the quality of education in New Orleans public schools. In 2024, while the percentages of parents offering public schools an A or B grade was consistent with last year, far more parents gave the schools a C this year (45%) than last year (27%) and far fewer gave the schools a failing grade. In fact, respondents assigning an F grade dropped from 16% in 2023 to only 2% in 2024. It is of note that the grades offered by parents with students in NOLA-PS schools and those without were nearly the same on this measure.
Subgroup Breakdown
Age: Similarly, as on other questions, older respondents offered more negative assessments than younger parents and guardians. 29% of 18-34 year olds gave schools a B, while 49% gave them a C. By contrast, 43% of respondents 55 years or older gave schools a D, and 30% gave schools a C.
Educational Attainment: As on other questions, lower educational attainment correlated with lower perceptions of public education. 34% of respondents with a high school degree or less gave schools a D, compared to 14% of college graduates.
Graduates: Respondents who had a recent graduate gave public education an A or B grade 42% of the time, which was nearly double the 23% who gave public education an A or B but did not have a recent graduate.
NCAP: Respondents who had completed an NCAP gave far higher grades to public education than those who had not. A majority of respondents, 53%, who had completed an NCAP gave public education a C, and 28% gave it an A or B grade, while 67% of parents who had not completed an NCAP gave the quality of public education a D.
Race: The percentage of respondents assigning C grades to the quality of public education were consistent across all Black, White, and Hispanic respondents (between 41% and 45%), but 44% of Hispanic parents and guardians gave schools an A or B, compared to 22% of White and 20% of Black respondents. Black (32%) and White (29%) respondents gave schools a D at around three times the rate of Hispanic respondents (10%).
Special Education: Notably, respondents from a household with a special education student seemed more satisfied with public education than those without: 30% of respondents with a special education student gave schools an A or B, compared to 24% of those without a special education student. 45% of both subgroups gave public schools a C.
Socioeconomic Status: Once again, there were marked differences in responses based on the socioeconomic status of the parents and guardians, with families from lower income households far more negative about public education. Respondents making $40,000 or less in household income were twice as likely to assign public education a D grade (40%) and those making $75,000 or more (20%).


Children’s Schools
What overall grade would you give the quality of education offered by your children’s school or schools?
For the past few years, as a follow up question to the grade for the quality of public education in New Orleans, we’ve also asked respondents who have a child in a New Orleans public school to give a grade to the quality of education provided by the actual schools attended by their children. In 2024, as was true in 2023, more parents gave their children’s schools an A or B grade than they gave to the public education system overall — this year, 42% gave an A or B grade, compared to 41% in 2023. Notably, the percentage giving their children’s schools a C grade nearly doubled this year, from 18% in 2023 to 35% in 2024. Interestingly, 31% of parents who gave public education a C grade, gave their own children’s schools an A or B, and 12% of those giving the entire system a D or F grade, ranked their children’s schools with a B. This indicates parents and guardians are more positive about the schools their children attend than the system overall.
Subgroup Breakdown
Age: Once again, older respondents offered more negative assessments than younger ones. 43% of respondents aged 55 or older gave their children’s schools a D, while 58% of respondents aged 18 to 34 gave their schools an A or B.
Educational Attainment: A majority, 58%, of respondents with a college degree or greater gave their children’s schools an A or B, while only 30% of those with a high school degree or less did so. Additionally, respondents with a high school degree were nearly three times as likely to give their children’s schools a D (27%) as more educated respondents (10%).
Multiple schools: Parents with children in more than one school rated the individual schools much higher than parents with children in only one school.
NCAP: Completing an NCAP seemed to correlate with more positive assessment of their children’s schools. 48% of respondents who completed an NCAP gave their children’s schools an A or B, compared to 13% of those who had not. 64% of parents from a household that had not completed an NCAP give their children’s schools a D. Additionally, 70% of those who completed an NCAP in the past year gave their children’s schools an A or B, compared to 52% of those who completed an NCAP earlier.
Race: Black and White respondents gave their children’s schools about the same rating and a mixed assessment overall, with most giving the schools a C grade. Once again, Hispanic respondents were more positive, with a majority (59%) giving their children’s schools an A or B.
Recent graduates and special education: A majority of households with recent graduates (68%) and special education students (65%) gave their children’s schools an A or B.
Socioeconomic status: The greater the income of the respondent, the more likely they were to give their children’s schools an A or B. A majority, 53%, of respondents making $75,000 or more in household income gave their children’s schools an A or B, compared to 22% of families with incomes of under $40,000.

Charter Schools
Please tell me whether you rate your feelings toward charter schools in New Orleans as very positive, somewhat positive, neutral, somewhat negative, or very negative?
Nearly every public school in New Orleans is a charter school. This makes the city’s education landscape unique compared to any other city in the United States. We have frequently asked parents and guardians about their opinions of charter schools since we started administering polls in 2007. In 2024, 24% of respondents gave charter schools in New Orleans a positive rating, 44% were neutral, and 29% were negative. The positive and neutral ratings were similar to when we last asked the question in 2022, but the negative responses were notably higher this year (8% were negative in 2022). Parents who were more positive in their assessments of New Orleans Public Schools and public education in the city in general, were also more likely to give positive responses about charter schools. Respondents without a student in a public school were also more likely to rate charter schools positively (33%) than those with a public school student (22%).
Black (32%) and White (33%) respondents reported negative perceptions more frequently than Hispanic parents and guardians (19%). Respondents from lower income households were more negative in their assessment than parents with higher household income. Most respondents in both subgroups, however, stated they were neutral about charter schools.

Orleans Parish School Board
Please tell me whether you rate your feelings toward the Orleans Parish School Board as very positive, somewhat positive, neutral, somewhat negative, or very negative?
The Orleans Parish School Board (OPSB) is the publicly elected board for New Orleans Public Schools. Most years, we ask parents and guardians to share their feelings about the OPSB. This year, ratings for OPSB were low, which was consistent with the results from 2023. Nearly twice as many parents expressed negative feelings about the OPSB (42%) as shared positives ones (22%) in 2024 (in 2023, the results were 42% negative, 25% positive); 33% said they were neutral. Notably, the only subgroups to give the OPSB net positive ratings were Hispanic and other race parents and guardians, while fewer than 20% of Black respondents gave positive rankings.

Top Priority for Orleans Parish School Board
What do you think should be the top priority for the incoming school board who will be elected this fall?
We also asked all respondents an open response question of what they thought the top priority should be for the incoming school board elected this fall to help to assess the preferences of parents and guardians about the future of public education in the city. Echoing responses to other questions about the primary concern of respondents facing both the city and public schools, 15% of respondents listed “safety”. This was followed by 10% who named “shorter bus routes”, 8% who named “teacher shortage”, 7% who said “better teachers”, and 6% who cited “improve quality”. No other response was cited by more than 5% of respondents.

Voting in 2024 Elections
There will be an election for Orleans Parish School Board in November of this year. As of now, are you almost certain to vote in the school board election, will you probably vote, are the chances 50-50, or don’t you think you will vote?
We also asked about the upcoming elections for the Orleans Parish School Board. However, of the seven-member board, only two of the seats are contested. We wanted to assess how likely respondents were to vote in this year’s election. We found that 78% of respondents said they were either almost certain or probably going to vote in this year’s election, while just 2% said they would not vote.
Subgroup Breakdown
Child Who Plans To Attend College: Respondents who stated they had a child who planned to attend college said they were certain to vote at more than double the rate of those who said they did not, 72% to 29%, respectively.
Education: Respondents with higher levels of education stated they were more certain to vote than those with less: 60% of college graduates said they were certain to vote, compared to 23% who had a high school degree or less.
Public school versus non-public school student: Respondents with at least one public school student were certain or probably going to vote at far higher rates (82%) of those who did not have a public school student (56%).
Race: Black respondents were less likely to say they were certain to vote (33%) than White respondents (42%).
Socioeconomic Status: Income correlated with a likelihood of voting for school board. 63% of respondents from families with income of $75,000 or above said they were certain to vote, compared to 19% of families with household income of $40,000 or under.


Best Part of System
What would you say is the best thing about the public education system in New Orleans?
In an open response question, we asked parents and guardians to name the best thing about the public education system in New Orleans. Notably, nearly one-half of parents and guardians did not have anything positive to say: 31% did not have a response, 14% said “nothing,” and 2% said “not much.” For those who did provide a positive attribute, 17% stated “teachers”, 5% “available”, 4% “choice/options”, 4% “good schools”, and 4% “improving”. No other response received over 2%.

Biggest Concern
Which one of the following would you say is your biggest concern about the public education system in New Orleans? (Select from: student safety and well-being; low enrollment; not enough high performing schools; teacher and staff shortages; the distance students have to travel to school; the impact of the high levels of poverty in New Orleans; how prepared students are for life after high school; not enough teachers who are native New Orleanians; availability of extracurricular activities like sports and band; lack of parental involvement; all; other)
When asked to choose their top concern about public education in New Orleans from an extensive list of possible options, respondents cited “student safety and well-being” most commonly (20%). This was followed by not enough “high performing schools” (16%), and “teacher and staff shortages” (11%) and “the distance students travel to school” (11%).

NCAP Completion
Have you ever filled out an NCAP, or One App as it was previously known, to enroll your children in a public school?
Parents and guardians who completed an NCAP in 2024 were more favorable toward the application and enrollment process and happier with the outcome than those who completed in previous years. Respondents still want to improve NCAP’s usability and have more higher quality school options.
Another unique feature of New Orleans’ public education system, is that there is near open enrollment, in which families fill out a single application (NCAP), where they rank schools located anywhere in the city based on where they want to go. They are then assigned to schools based on an algorithm.
This year, 75% of respondents stated they personally had filled out an NCAP at some point in time. Additionally, among those who had not personally completed the application, 25% noted that someone else in their household completed an NCAP at least once. In total, 81% of respondents to this year’s survey were from a household that had completed an NCAP at any time. Of that group, 32% completed an NCAP in 2024, 43% said they did so before 2024, and 25% didn’t know. Notably, public school parents who said their household had never completed an NCAP also had overall negative responses to questions related to public education throughout the poll.
NCAP Satisfaction
Overall, are you generally very satisfied, satisfied, dissatisfied, or very dissatisfied with the schools where NCAP has placed your children over the past few years?
Given that such a high percentage of parents complete an NCAP, we also thought it was imperative to assess how satisfied they were with their ultimate school placement. Notably, for those who had completed an NCAP, satisfaction with the placement results was slightly higher this year compared to last year: 54% of respondents were satisfied with their placements, which was a slight uptick from 51% last year. However, the more noticeable shift was a decline in the percentage of respondents who were very dissatisfied with their results — it decreased from 32% in 2023 to just 4% in 2024.
In looking through responses by subgroups, respondents who were most pleased with their placement were respondents with children at more than two schools, those with children in grades 9 through 12, those who had completed an NCAP in 2024 as opposed to previous years, and Hispanic parents. Parents and guardians who had lower than average levels of satisfaction were those with children in only one school, those with household incomes under $40,000, and Black parents.
NCAP Usability
Based on your family’s experience, would you say the NCAP is very easy, easy, difficult, or very difficult to use?
Given the inherent complexity in New Orleans’ public education system, we also wanted to assess how easy or difficult it was for respondents to use NCAP. A plurality of respondents, 46%, who had filled out an NCAP said that the application was difficult or very difficult to use, compared to 37% who said it was easy or very easy to use.
Higher income parents were the most critical of NCAP’s usability, with 72% saying it was difficult or very difficult. Black respondents were more likely than respondents from any other race to say NCAP was difficult to use. A majority of both White and Hispanic respondents found it easy to use.
By comparison, respondents who completed an NCAP in 2024 were more likely to say they found it very easy or easy to use than those who completed an NCAP before 2024, so it does appear changes to the application have had the intended impact of improving usability. Additionally, women found it easier to use than men.

Conclusion
Overall, the parents and guardians we polled this year appear slightly more optimistic about the state of New Orleans generally, and public education in the city than in 2023. However, this poll’s findings continue to indicate there are significant disparities in how different demographic populations feel about public education, along with their access to high quality instruction and schools. A consistent theme this year, as in our recent polling, is that Hispanic parents are far more positive about the state of education in New Orleans, than White, and especially Black parents and guardians. Additionally, lower income respondents collectively have far more negative perceptions about public education than those with higher annual income. The level of educational attainment of respondents also correlates with their perceptions of quality and satisfaction with public education, as parents and guardians who have higher levels of education appear more able to navigate the complex New Orleans education landscape to ensure their children have access to high quality options. This perceived inequity to opportunities and quality is an issue — we would encourage the incoming members of the School Board to continue to try to address.
As mentioned in the introduction, this is the first of two briefs the Cowen Institute will release on the 2024 poll findings. The second will be released in December 2024. That brief will include respondents’ perceptions on postsecondary success, college access, college affordability, and career and technical education, amongst other topics.
Brief 2 2024-2025: Parents’ and Guardians’ Opinions on K-12 Public Education in New Orleans
Executive Summary
The Cowen Institute has conducted annual polls on perceptions of public education in New Orleans since 2007. Our polls are designed to provide insight into how parents, guardians, and the general public view New Orleans’ highly decentralized K-12 public education system. Each year, we include new questions about the most relevant and pressing issues facing educators and families. We also repeat questions from our previous polls to assess how opinions change over time on a few key topics.
This is the second of two briefs released in the 2024-2025 school year with results from polling conducted in the fall of 2024. We present the data in this way to make it more accessible for readers — the briefs allow us to group the findings by topic, enabling us to surface trends about particular areas of the city’s education system.
To capture the experiences and attitudes of a wide range of parents, as we have done since 2020, we polled 1,000 public and private school parents and guardians in Orleans Parish, as well as a small number who homeschool their children.
The topics covered in this brief include:
- Policy changes in schools
- FAFSA
- Postsecondary education
- High school courses
- Employment
- Life after high school
Methodology
This is part two the 15th opinion poll on public education in New Orleans published by the Cowen Institute since 2007. The survey items were developed by the Cowen Institute in consultation with LJR Custom Strategies, a strategic research and consulting firm led by Principal Jennifer Johnson. LJR has led our polling over the past six years. Questions were created by the Cowen Institute in partnership with LJR and feedback from external stakeholders in the New Orleans education community.
This was a survey of 1,000 adults who reside in Orleans Parish and are the parent/guardian/responsible party for one or more children who currently reside in their household and attend a K through 12 school or are homeschooled. It was conducted from August 21-September 3, 2024 via landline and cell phone. The findings applying to the 1,000 sample are subject to a sampling error of plus or minus 3.1%; subgroups of the sample are subject to error of up to plus or minus 10%. Please note that when percentages in responses do not add up to 100%, it is due to rounding.
Demographics
Key Findings
Direct Run Schools
Please tell me whether you strongly support, support, oppose, or strongly oppose New Orleans Public Schools directly running schools again.
In August 2024, New Orleans Public Schools (NOLA-PS) opened its first traditional, district-run public school since 2019 — the Leah Chase School. In February 2024, the Orleans Parish School Board voted to open the school where Lafayette Academy previous operated. The Leah Chase School is not a charter school. Instead, NOLA-PS staffs and operates the school directly. By comparison, NOLA-PS is the authorizer or governing authority for the vast majority of charter schools in the city, meaning it grants the charters that allow those schools to operate, but does not have a say over how to run or staff the schools; charter operators make those decisions.
The decision to reopen a direct-run school after being the nation’s first all charter school district was a monumental one. It could indicate a shift towards more direct-run schools in the future. It also required to the district to shift resources to operating the school.
We asked parents and guardians how they felt about the change and NOLA-PS’s move to operate a school. We found that a majority, 51%, either strongly supported or supported NOLA-PS directly running schools again, while 18% opposed or strongly opposed the decision. However, it is important to note that 31% of respondents stated they didn’t know or refused to answer the question, which was one of the highest rates of any question we asked in the year’s polling. Both parents and guardians of public and non-public school students had the same rates of support for NOLA-PS directly running schools.
Subgroup Breakdown
Child Plans to Attend College: Parents and guardians who stated they had a child who planned to attend college were significantly more likely to support NOLA-PS directly running schools (66% supported or strongly supported) than those who said their child(ren) would not attend college (48% supported or strongly supported).
Educational Attainment: Respondents who had graduated from college were twice as likely to support NOLA-PS directly running schools (76% supported or strongly supported) as respondents with a high school degree or less (38% supported or strongly supported).
Grade for NOLA-PS: Respondents who gave NOLA-PS a higher grade on its performance were more likely to support the district directly running schools. 82% of respondents who gave NOLA-PS an A or B grade supported the decision, while only 32% of respondents who gave NOLA-PS a D or F did so.
Race: Hispanic respondents were more likely to support NOLA-PS direct run schools (63% supported or strongly supported) than Black (45% supported or strongly supported) and White (49% supported or strongly supported) respondents.
Socioeconomic Status: Respondents making $75,000 or more per year were more than twice as likely to support NOLA-PS direct run schools (71% supported or strongly supported) as respondents with household incomes under $40,000 (31% supported or strongly supported).

Cellphones
Please tell me whether you strongly support, support, oppose, or strongly oppose prohibiting students from using cell phones in public schools.
In 2024, the Louisiana Legislature passed a law targeted at limiting students’ use of cell phones while in school. The law specifically stated that phones and other electronic devices have to be “properly stowed away” or “prohibited from being turned on” while students are at school. However, the law left it up to each district (or charter management organization) to decide how to implement the new requirement, giving them discretion as to whether students could keep their shut-off phones in their backpacks or had to turn them into school staff at the beginning of the school day. Prior to the passage of the law, students could have their cell phones in school, but were not supposed to use them. However, according to news reports and the legislators who passed the ban, it was easy for many students to use their phones anyway. The intention of the law was to limit usage to help students avoid distractions and focus more on their school work and interactions with classmates and educators.
We wanted to assess parents’ and guardians’ reaction to the new law. We found 68%, a supermajority of respondents who had a child in a New Orleans Public School, strongly supported or supported the new cell phone ban. Notably, at least 60% of respondents across all educational attainment, income, age, and race subgroups supported the law.

FAFSA
In 2018, the Louisiana Legislature implemented a policy that required all high school students to fill out the Free Application for Federal Student Aid (FAFSA) in order to graduate. The goal of the requirement was to ensure as many Louisiana students as possible could qualify for federal financial assistance for postsecondary higher education institutions, such as Pell Grants. The policy immediately increased FAFSA completions in the state by 20%; in 2023, Louisiana led the nation in the percentage of high school students completing the FAFSA. Despite this increase in completions, in March 2024, the Louisiana State Board of Elementary and Secondary Education repealed the requirement, with state education officials citing privacy concerns as the reason.
The Cowen Institute had advocated for the original requirement and also objected to the removal of the requirement. We continue to support the FAFSA requirement as a way to enable more students from low-income backgrounds and first generation students to afford college.
Due to the importance of the issue, this year, we asked parents and guardians about their perceptions about FAFSA and the FAFSA requirement reversal. We asked two questions focusing on FAFSA and the FAFSA requirement.
FAFSA Question 1: Are you very familiar, familiar, not very familiar, or not familiar at all with The Free Application for Federal Financial Aid, also known as FAFSA, which determines the amount of federal, state, and university aid a student may be eligible for to attend college?
First, we asked a question to assess how familiar parents were with FAFSA overall. Collectively, 55% of respondents stated they were very familiar or familiar with FAFSA, while 34% said they were not very familiar or not familiar at all. Notably, respondents without a student in New Orleans public schools were more likely to state they were very familiar or familiar with FAFSA (74%) than those who did have a public school student (52%).
Subgroup Breakdown:
Age of Student in Household: Respondents with a student in high school were more likely to be very familiar or familiar with FAFSA (62%) compared to respondents with students in grades 6 to 8 (58%) or kindergarten through 5 (51%), and 80% of respondents with a recent high school graduate also expressed familiarity.
Educational Attainment: Just 35% of respondents with a high school degree or less said they were very familiar or familiar with FAFSA, compared to 79% of respondents with at least a college degree.
Socioeconomic Status: Highlighting a consistent trend in this year’s polling, wealthier families seem to have access to more information about important policies impacting their children’s education than lower income families. Nearly three times as many respondents from higher income households stated they were very familiar or familiar with FAFSA (82%) than those from lower income households (29%).
FAFSA Question 2: Please tell me whether you strongly support, support, oppose, or strongly oppose requiring all Louisiana high school students to fill out a FAFSA, which makes them more likely to go to college.
We saw overwhelming support for the FAFSA requirement amongst parents and guardians: A large majority of respondents, 64%, stated they either strongly supported or supported requiring all high school students in Louisiana to complete the FAFSA in order to graduate, while only 4% said they opposed or strongly opposed. A majority of respondents in nearly all demographic subgroups stated support for the requirement, with support especially high among respondents with a recent high school graduate (90%), those with a child that planned to attend college (96%), families with a special education student (84%), respondents with a college degree (88%), families making between $40,000 and $74,999 (68%) and those making $75,000 or above (90%), and across all races (Black — 55%, White — 69%, Hispanic — 70%). The demographic subgroup with the lowest rates of support for the requirement were low-income respondents from households making under $40,000, with just 36% expressing support. However, it is worth noting that just 4% of low-income respondents stated they opposed the requirement, while 60% said they didn’t know how to answer or refused to do so.

Life After High School
College Matriculation
Do one or more of your children currently plan to attend a four-year college or university after they graduate from high school?
We wanted to assess how many parents and guardians currently anticipated that their children would attend a four-year college or university after graduating high school. Research from the U.S. Department of Education and Georgetown University indicates that college graduates earn significantly more over the course of their lifetimes than individuals with only high school degrees; a postsecondary diploma can be a gateway to a more financially secure adulthood.
Only 32% of respondents stated they had a child who currently planned to attend a four-year college or university, while 34% said they did not. As with the responses to many of our other questions, the socioeconomic status and educational attainment of respondents mattered a great deal in how they answered this question. 66% of respondents earning $75,000 or more stated they had a child who planned to attend a four-year college or university, compared to 13% of respondents earning under $40,000. Additionally, 62% of respondents with a four-year college degree said their children intended to pursue this path, compared to 16% of respondents with a high school degree or less. More White (37%) and Hispanic (36%) respondents said their children were planning to attend a four-year program than Black respondents (23%).

Education Savings
Which of the following is the main way you plan to pay for your child’s or children’s college education? (Options included: A 529-B college savings plan; TOPS; V-A benefits; Scholarships; Personal funds; Something else)
We asked a follow-up question of the 32% of respondents who stated they had a child who was currently planning to attend a four-year college or university — namely, how they intended to pay for that education.
A plurality of respondents, 29%, said they were planning to pay for their children’s college education using a combination of the options we outlined in the question. The second most common answer was that respondents said they were unsure how they planned to pay for it at this time. For respondents who gave a single answer, 16% said scholarships, followed by 13% who named personal funds. Only 6% of respondents named TOPS.
Are you currently saving for your children’s postsecondary education?
College costs continue to rise in Louisiana and nationally. Part of the reason FAFSA completion is so vital is that it enables qualifying students to access federal aid that makes postsecondary education more affordable — which is especially important given these growing costs. We wanted to assess whether parents and guardians were saving for their children’s postsecondary education and if so, how.
Just 33% of respondents said they were saving for education after high school, compared to 55% who said they were not. Understandably, parents and guardians with a student in high school were the most likely to say they were saving compared to respondents with students in younger grades. Additionally, 76% of respondents who said they had a child who intended to go to college said they were currently saving, while 83% of parents who said their child was not planning to attend college said they were not saving. However, there were other significant differences in responses based on the demographic subgroups of respondents.
Subgroup Breakdown
Educational Attainment: College graduates were nearly seven times as likely (71%) to say they were saving for their children’s postsecondary education as respondents who had a high school degree or less (11%).
Public Versus Non-Public Students: A near majority, 48%, of respondents without any public school students said they were saving for postsecondary education compared to 30% of respondents with a student in public schools.
Race: Twice as many White (40%) and Hispanic (40%) respondents said they were saving for postsecondary education compared to Black respondents (20%).
Socioeconomic Status: Respondents making $75,000 or more per year said they were saving for postsecondary education at eleven times the rate of respondents making under $40,000 — 77% to 7%, respectively.


Post Graduation
What are these recent graduates in your family currently doing? Are they attending a four year college or university; attending a two year college or technical school; working full time; working part time; looking for a job, or something else?
One of the core pillars of the work of the Cowen Institute is to examine whether New Orleans high school students are succeeding educationally and professionally once they graduate. This year, to help better understand the current outcomes for recent graduates, we asked parents and guardians who had a recent graduate in their household, what those young people were currently doing.
We found that 10% of all respondents who took the survey had at least one child who graduated in 2022, 2023, or 2024. 84% of these parents and guardians of a recent graduate said that their graduate still lived in New Orleans.
Of the 10% of all respondents who had a child who recently graduated high school, 33% said their child was attending a four year college, while 24% said they were attending a two year college or vocational school. Additionally, 32% said their child was working full time, 27% said their graduate was working part-time, and 12% said they were looking for a job, while 2% said something else (note, total percentages exceed 100% because a student could be a current student at a postsecondary institution and employed).
Interestingly, the educational attainment of the respondent did not seem to make as much of a difference on this question as others in the survey. 41% of respondents who were college graduates said that their recent high school graduate child was currently attending a four year college, which tracked closely to the 38% of respondents with a high school degree or less. However, household income did seem to matter — 46% of respondents from a household with income of $75,000 or above said their recent graduate was currently attending a four year college or university, compared to 25% of respondents with household incomes of less than $40,000.


High School
High School Courses
Understanding that both are important, please tell me which one of the following statements you agree with more. If you had to choose, which one would you say you agree with more? I think it is more important for New Orleans high schools to offer advanced academic programs, like honors and AP classes OR I think it is more important for New Orleans high schools to offer career and technical programs?
High schools in New Orleans and across Louisiana are increasingly trying to integrate more Career and Technical Education (CTE) courses into their offerings for students. These courses allow students to learn technical skills while in high school that they can later use to find and keep employment in specific industries once they graduate. For instance, some courses offered in Louisiana include software coding, manufacturing, and the building trades.
In the past, we have asked parents and guardians whether they were in favor of New Orleans public schools offering CTE courses. We consistently found an overwhelmingly majority (greater than 80% of respondents) supported offering CTE coursework. This year, we wanted to get a better sense of whether respondents favored CTE course offerings when compared to AP and other advanced academic programs.
A majority of respondents (53%) said they favored New Orleans high schools offering CTE programs, which was nearly twice the rate who said they preferred AP and other academic programs (27%); 16% of respondents answered “both.” This suggests parents and guardians favor high schools offering coursework that more directly links high school students to specific career pathways after they graduate.
Subgroup Breakdown
Educational Attainment: A majority of respondents of all educational backgrounds said they preferred that high schools provided CTE offerings, including 50% of respondents with a college degree (35% of whom named academic offerings).
Income: The rate of respondents stating they wanted high schools to offer advanced academic coursework increased with income: 16% of respondents from families making under $40,000 chose academic options compared to 41% of respondents making $75,000 or above. The inverse trend was true for preferring CTE offerings, with 57% of those making under $40,000 naming CTE, compared to 44% of those making $75,000 or above.
Intent to Attend College: Respondents with a child who intends to attend college were nearly twice as likely to respond that they preferred high schools offering advanced academic coursework than those who said they didn’t intend for their child to attend college. Overall, 46% of respondents of children with college plans preferred academic coursework, while 44% named CTE offerings, compared to 25% of respondents of children without college plans who chose academic courses and 55% who selected CTE.
Race: Hispanic respondents were split in their preferences, with 43% preferring academic coursework and 43% preferring CTE offerings. Comparatively, majorities of both Black (50%) and White (58%) respondents preferred CTE course offerings (25% of Black and 26% of White respondents said they preferred academic coursework).


Employment
We wanted to assess how many families currently had a high school student who was employed part-time. We asked this question in order to get a sense of how many high school students were juggling both work and their education, as well as how many students were learning the important soft skills and accruing the social capital that working can provide. We then asked a follow-up question to respondents with a child who was currently employed to determine whether they believed working was helping or hindering their students’ academic performance.
Employment Question 1: Do any of your children have a part time job during the school year? (Asked only of respondents with at least one student in the grade 10 or above in the household)
Only 34% of respondents with at least one student in grade 10 or above in their household reported that their child was currently employed, compared to 66% of respondents who said their high school student did not work.
Respondents from wealthier households and who had higher educational attainment were more likely to say they had a student who was currently employed: 45% of college graduates with a tenth grader or above said their child worked, compared to 22% of those with a high school degree or less; additionally, 38% of respondents with incomes of $75,000 or above had a student who was employed, which was nearly five times the rate of the 8% of respondents with household incomes of less than $40,000. Hispanic (38%) and White (35%) respondents were more likely to have a student who was employed than Black respondents (28%).
Employment Question 2: Do you think your children having a part time job generally helps or hurts their ability to succeed in school?
By a wide margin, respondents thought working was beneficial for their student who was employed. 64% of parents and guardians with a working high school student said that having a part-time job helped their child, compared to just 3% who said it hurts (note: 29% said something other than that it helped or hurt).


Conclusion
This year’s poll surfaces themes we have seen in previous years — namely, that the socioeconomic status, race, and educational level of parents greatly impacts how their children access educational opportunities in the city during their K-12 years and after. As shown in this brief, parents and guardians with higher levels of wealth and educational attainment were more likely to state they had children who either planned to attend a four year college program or who already were. Additionally, those same subgroups of parents were more likely to save for postsecondary education than other respondents.
This brief, along with the first brief we published in November, highlight just how differently families can experience education in the city due to their backgrounds. Policies that promote equity and offer students and families opportunities, including access to postsecondary education, are vital to help level the playing field.