Each year, we ask some new questions about the most relevant and pressing issues facing educators and families. We also repeat questions from our previous polls to assess how opinions change over time on a few key topics.
Brief 1: Parents and Guardians’ Opinions on K-12 Public Education in New Orleans
Overview
The Cowen Institute has conducted annual polls on perceptions of public education in New Orleans since 2007. Our polls are designed to provide insight into how parents, guardians, and the general public view New Orleans’ highly decentralized K-12 public education system. Each year, we ask some new questions about the most relevant and pressing issues facing educators and families. We also repeat questions from our previous polls to assess how opinions change over time on a few key topics.
We now release the poll findings in a series of briefs at the start of each year. This is the first of two briefs that will be released in 2024 with results from polling conducted in the fall of 2023. We present the data in this way to make it more accessible and understandable for the general public — the briefs allow us to group the findings by topic, enabling us to surface trends about particular areas of the city’s education system.
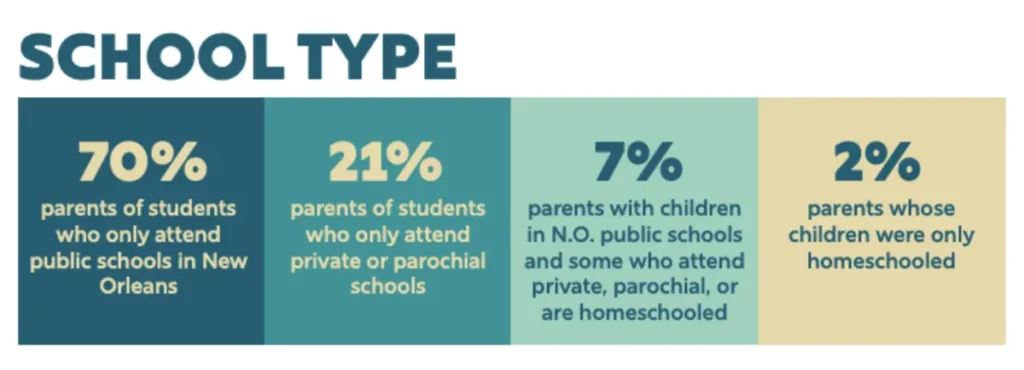
This brief covers general perceptions about New Orleans K-12 public education; the second brief will delve more deeply into specific areas of education. To capture the experiences and attitudes of a wide range of parents, as we have done since 2020, we polled 1,000 public and private school parents and guardians in Orleans Parish, as well as a small number who homeschool their children.
Methodology
This is the 14th opinion poll on public education in New Orleans published by the Cowen Institute since 2007. The survey items were developed by the Cowen Institute in consultation with LJR Custom Strategies, a strategic research and consulting firm led by Principal Jennifer Johnson. LJR has led our polling over the past six years.
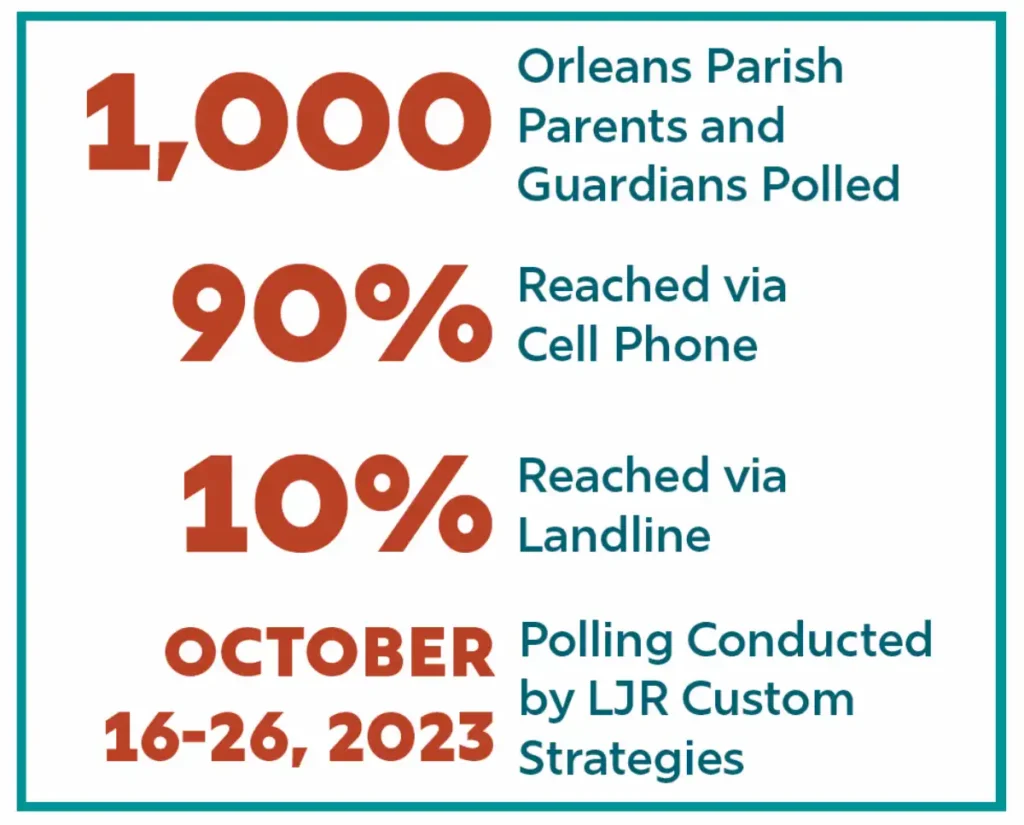
For this poll, LJR surveyed 1,000 adults who reside in Orleans Parish and are the parent / guardian / responsible party for one or more children who currently reside in their household and attend a K-12 school or are homeschooled. The poll was conducted from October 16-26, 2023, via landline and cell phone, with 90% of respondents reached by cell phone and 10% reached by landline. Findings applying to the 1,000 person sample are subject to a sampling error of plus or minus 3.1%; subgroups of the sample are subject to error of up to plus or minus 10%. Please note that when percentages in responses do not add up to 100%, it’s due to rounding.
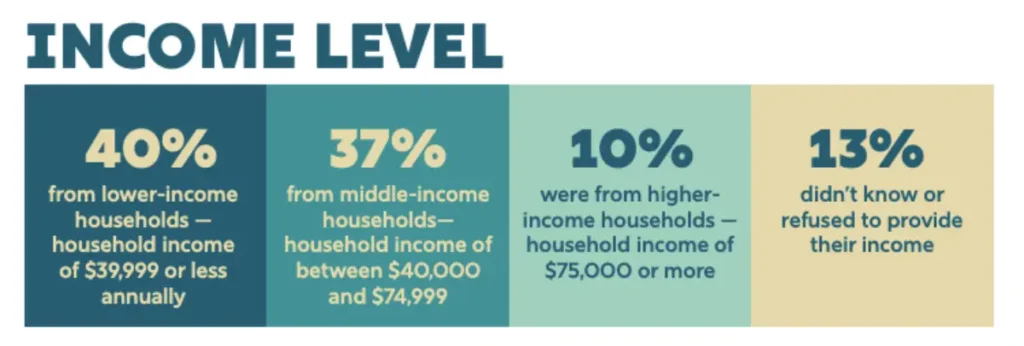
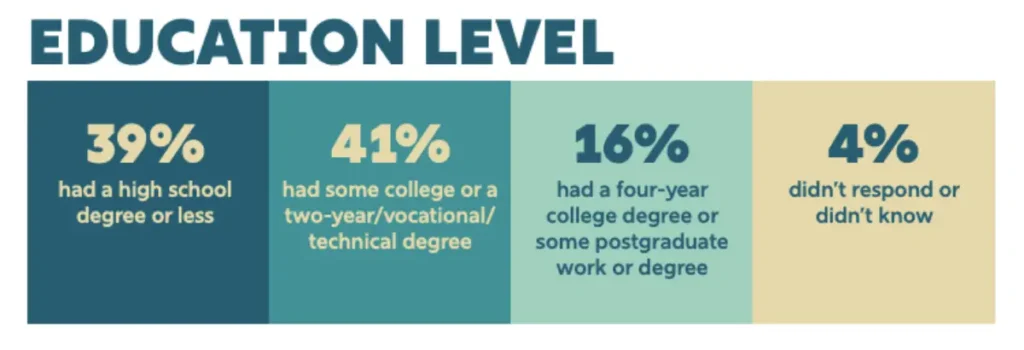
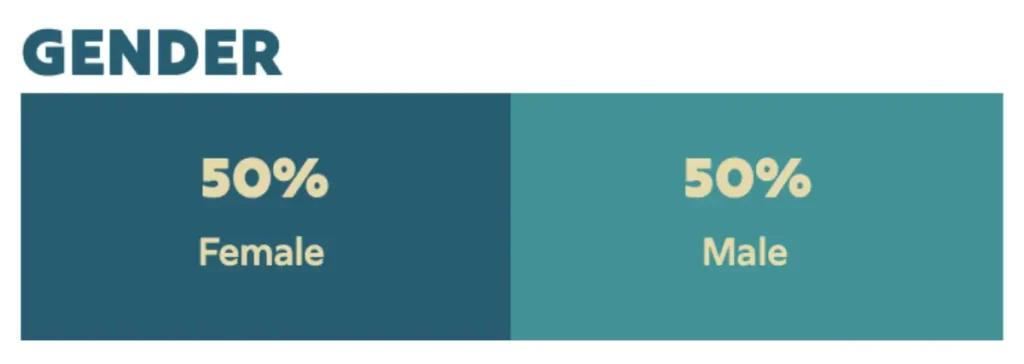
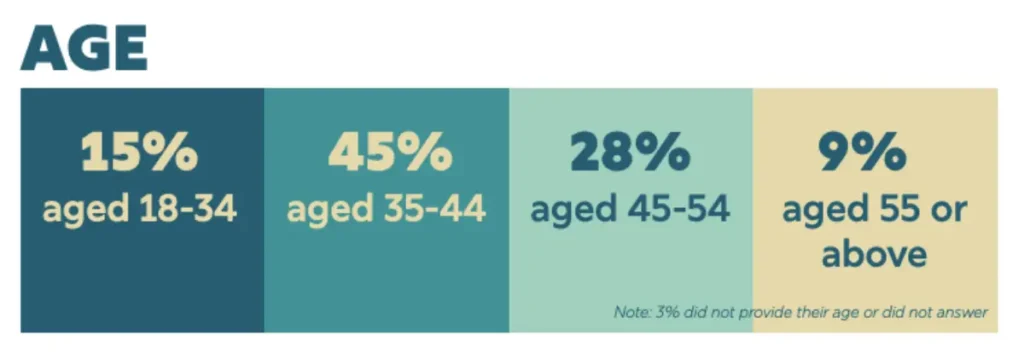
Demographics
Key Findings
Overall dissatisfaction
We found considerable dissatisfaction amongst parents and guardians regarding public education in the city, but also about the direction of New Orleans under its current leadership. Negative perceptions about the city in general and education specifically were higher than at any point over the past five years. Assessments of New Orleans Public Schools (NOLA-PS) have become more negative over the past year, though parents with younger children were more favorable than parents of older children.
Racial differences
Generally, Black respondents had higher levels of dissatisfaction with the public education system than White and Hispanic respondents. This echoes previous polling by the Cowen Institute that suggests parents and guardians’ experience with public education in the city may vary greatly by their race.
Socioeconomic differences
As we have seen in previous polls, respondents from wealthier households typically have more positive views about public education than those from lower-income households. Similar to race, this suggests that the socioeconomic status of families may impact their ability to navigate school choice, as well as their satisfaction with their public education opportunities.
Direction of the city
This year, we wanted to place respondents’ perceptions about public education in New Orleans in context with how they felt about the overall direction of the city. As a result, we asked how satisfied they were with the direction of New Orleans under its current leadership. A majority of respondents, 52%, stated they were either not very satisfied or not satisfied at all, compared to 46% who stated they were very or somewhat satisfied.
Income: Higher income respondents were the least satisfied with the direction of the city, but a majority of respondents from all incomes were dissatisfied: 61% of respondents with household incomes of $75,000 or higher were either not very satisfied or not satisfied at all, compared to 54% middle income respondents, and 57% of lower income respondents (note: 13% of respondents did not share a response).
Perceptions of education: Notably, satisfaction with the direction of the city corresponds very closely to respondents’ assessment of public schools. 85% of those who gave schools an A or B grade were very or somewhat satisfied with the direction of the city, while 48% of those who gave schools a C were very or somewhat satisfied and 47% were not very or not at all satisfied, and 77% of those who gave the schools a D or an F were not very or not at all satisfied with public schools.
Race: A majority of both Black (56%) and White (54%) respondents were dissatisfied with the direction of the city, while a majority of Hispanic respondents (62%) expressed satisfaction with the direction of the city.
Education: A majority of respondents with both lower levels of education (a high school degree or less) and higher levels of education (those with a college degree or more) were dissatisfied with the direction of the city.

Top Issues
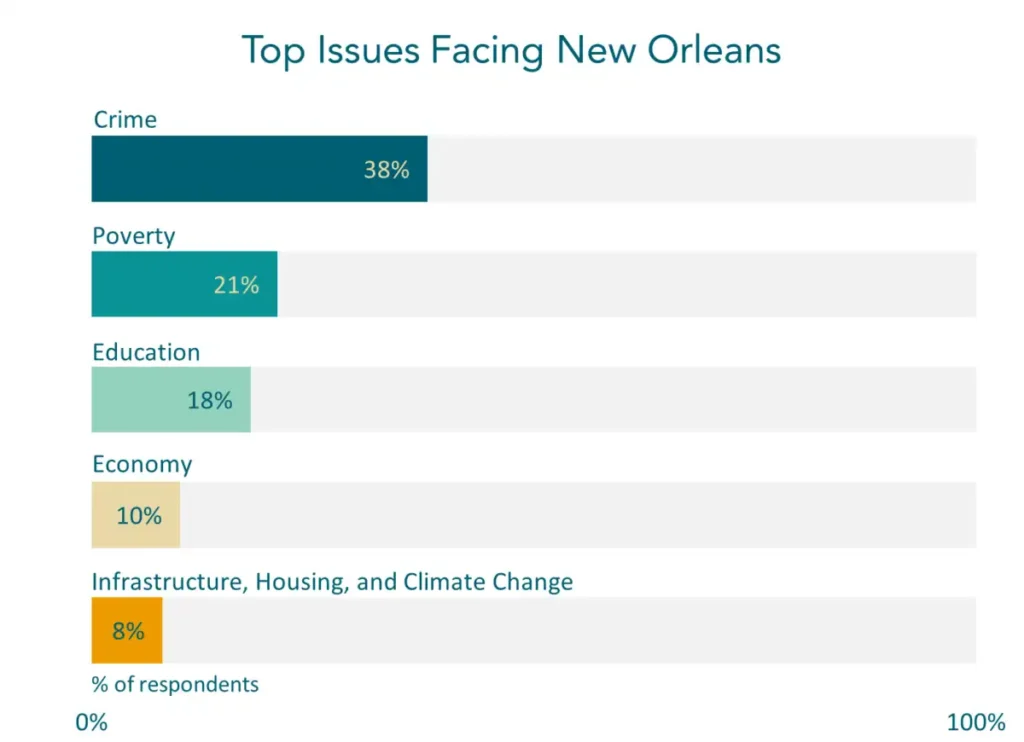
In our recent polls, we have offered parents and guardians a list of issues that New Orleans is facing and then asked them which issue concerns them the most. Our list has changed slightly over time: this year, it included the economy, education, poverty, crime, infrastructure (like roads and the sewer and water system), housing costs, and climate change/extreme weather.
A plurality of respondents, 38%, stated that crime was their top concern — crime was also the top concern last year, but the percentage who cited it increased in 2023, rising 11% from the 27% who named it last year. Poverty (21%) and education (18%) were the other top two concerns of respondents, which were largely consistent with last year’s results (poverty and education were both at 21% in 2022). The economy was cited by just 10% of respondents, which was a large drop from last year, when 19% of respondents named it as their top concern. Housing costs, infrastructure, and climate change combined were the top concern for less than 10% of respondents overall.
Income: Crime was the top concern of a majority of wealthier respondents (52%) and lower income respondents (45%). For middle income respondents, crime (32%) and poverty (32%) tied as the top concerns. Education was the second highest concern for lower income respondents.
Race: Black respondents (44%) were the most likely to name crime as their top concern, though it was also the top concern for White (35%) and Hispanic (34%) respondents. Black respondents (23%) were also more likely to name education as their top concern than White (14%) or Hispanic (11%) respondents. Nearly twice the number of White respondents (28%) cited poverty as their top concern compared to Black respondents (15%).
Perceptions of Public Education: Respondents who named crime as their top concern were also likely to be those who also gave public schools in the city more negative grades.
Education: Crime was by far the highest concern for both those with a college degree or more (41%) and those with a high school degree or less (43%), compared to respondents with some postsecondary education (32%).
Age: Responses were generally consistent across all age groups.
NOLA Public Schools
New Orleans has a highly decentralized public education system in which most major decisions (such as hiring and firing of staff, as well as curriculum choices) that happen in schools are controlled by charter leaders and Charter Management Organizations (CMOs). Compared to most other U.S. school districts, New Orleans Public Schools (NOLA-PS), the central office and administrative entity that oversees the vast majority of public schools in the city, plays a far less top-down role. Instead, NOLA-PS’ main role is that of authorizer for the charter schools under its purview, which includes holding those schools accountable to agreed upon metrics and standards. NOLA-PS is led by Superintendent Dr. Avis Williams and its work is overseen by a seven-member school board. Each year, we ask parents and guardians to weigh in on how they feel about NOLA-PS.
This year, we found favorability towards NOLA-PS had declined compared to 2022, while negative ratings had increased. Overall, this year, 29% of respondents stated they had a very or somewhat positive view of NOLA-PS compared to 31% in 2022. More notably, 42% said they had a very or somewhat negative view of NOLA-PS, which was a noticeable jump from the 11% who gave those answers last year. This continues a trend in our polling of decreasing favorability ratings for NOLA-PS since 2020. The percentage of respondents stating they have very or somewhat positive views of NOLA-PS has gone from 44% in 2020 to 34% in 2021 to 31% and 29% the past two years.
Public versus non-public: Among families with a student who attended a NOLA-PS school, 30% had very or somewhat positive views of NOLA-PS, while 41% had very or somewhat negative perceptions. Respondents without a student in NOLA-PS schools had far lower favorability ratings, with 21% having very or somewhat positive views, compared to 46% with very or somewhat negative ones.
Grade level of students: Interestingly, respondents with children in K-5 grades had the most positive attitudes towards NOLA-PS (35%), while ratings dropped among those with students in grades 6-8 (28%) or 9-12 (29%).
Income: Positive perceptions of NOLA-PS were nearly consistent among the highest (19%) and lowest income (21%) respondents.
Race: 22% of Black respondents had positive views of NOLA-PS, compared to 30% of White respondents (negative views were nearly equal at 48% and 46%, respectively). Interestingly, Hispanic respondents were one of the few subgroups with majority positive views of NOLA-PS (55% positive to 10% negative).

Public education
Annually, we ask parents and guardians whether they believe public education in the city is getting better, staying the same, or getting worse. This year, we found responses were slightly more negative than in 2022.
Overall, 23% of respondents said public education was getting better, compared to 20% in 2022 (by comparison, in 2020, 41% of respondents said it was getting better). A plurality, 42%, said public education was getting worse (up from 35% last year), while 30% said it was staying the same (down from 35% last year).
Public versus non-public: Negative perceptions were essentially the same for respondents with and without a NOLA-PS student (43% to 41%, respectively), though respondents with a student in a NOLA-PS school were more likely to say schools were getting better (25% to 15%).
Grade level of students: Responses seemed to be impacted by the age of students: A majority of respondents with students in grades 6-8 (55%) and 9-12 (50%) stated public education was getting worse, which was nearly twice the percentage of those with students in grades K-5 (28%).
Income: Notably, wealthier respondents were far less likely to say public education was getting worse compared to lower-income parents. Just 7% of wealthier respondents said schools were getting worse, compared to 51% of those from middle income households, and 55% of those from lower income households.
Gender: Men were more likely to say public education was getting worse (48%) than women (37%).
Race: Black respondents had the most negative views of public education, with a majority, 53%, saying it was getting worse, compared to 42% of White respondents, and just 2% of Hispanic respondents.

Education Quality
Each year, we also ask parents and guardians to grade the quality of education offered by public schools in New Orleans. Responses this year once again were more negative than in previous years. Overall, a plurality of respondents, 30%, gave the quality of education a D grade — the first time the D grade has been the most common response in our polling.
Last year, just 9% gave D as their answer, indicating a more than three-fold jump this year. 27% of respondents gave public education a C, 19% a B, 16% an F, and 7% an A (compared to 55% for C, 20% for B, 3% for F, and 4% for A last year). That means that, this year, 46% of respondents gave public education a D or F grade, which is nearly four-times higher than the 12% who did so last year. By means of comparison, in 2021, we found that 48% of respondents gave public education an A or B grade; this year, 26% did so.
Public versus non-public: Ratings were slightly higher for respondents with a student in a NOLA-PS school than for those without one, but 45% of NOLA-PS respondents gave public education a D or F grade.
Grade level of students: Once again, parents and guardians of K-5 students were more positive than those with older students — 35% of K-5 parents and guardians gave schools a C, compared to 19% of those students in grades 6-8, and 23% of those with students in grades 9-12. A majority of those with students in grades 6-8 (55%) and 9-12 (50%) gave schools a D or F, which was far higher than K-5 parents and guardians (33%).
New Orleans Common Application (NCAP): It’s worth noting that respondents who completed the NCAP were far more positive towards public education than those who had not gone through the admissions selection process or had not completed the NCAP for their family. 41% of parents and guardians who had gone through NCAP gave public education an A or B, 40% gave it a C, and 19% gave it a D or F; comparatively, 87% of respondents who had not gone through NCAP gave public education a D or F.
Income: Ratings for public education rose with respondents’ income level. A majority, 58%, of lower income respondents gave schools a D or F, compared to 27% of wealthier respondents.
Gender: Men were once again more likely to give lower ratings, with 52% giving schools a D or F compared to 41% of women.
Race: Black respondents were again more likely to have negative views of public education, with a majority, 56%, giving schools a D or F, compared to 47% of White respondents, and just 8% of Hispanic respondents.

Individual schools
This year, we introduced a new question to assess how satisfied parents and guardians with student(s) in a NOLA-PS school were with the quality of education provided by the school(s) their child(ren) actually attended. We wanted to assess whether respondents had different perceptions about the educational experience of their children compared to their perceptions of the system overall.
Notably, respondents were far less negative about the quality of education provided by their children’s schools than they were of public education in the city generally: 41% of parents and guardians gave the quality of education at their school an A or B grade, compared to 18% who gave it a C, and 21% who gave it a D or F. It should also be noted that 22% did not provide a grade for their child(ren)’s school.
Public versus non-public: Parents and guardians with a child in a NOLA-PS school were more likely to give schools an A or B if they had children in more than one school, than if they only had a child attending a single public NOLA-PS school. A majority, 54%, of respondents with children in more than one NOLA-PS school, gave the quality of education at those schools an A or B, compared to 33% of those who only had experience with one school.
Grade level of students: Parents and guardians of younger students were again more positive than those with older students. A majority of K-5 parents and guardians, 50%, gave the quality of education at their students’ schools an A or B, compared to 34% of those with students in grades 6-8, and 35% of those with students in grades 9-12.
Income: Wealthier respondents were far more satisfied with the quality of education at their child(ren)’s school than lower income respondents, with 69% of wealthier parents giving an A or B grade, compared to 31% of lower income respondents, and 33% of middle income. Notably, 31% of lower income respondents did not give their child(ren)’s school a grade.
Race: Black respondents offered lower ratings for their child(ren)’s schools than White respondents, with 31% giving their schools an A or B, compared to 43% of White respondents; 65% of Hispanic respondents gave their child(ren)’s school an A or B.


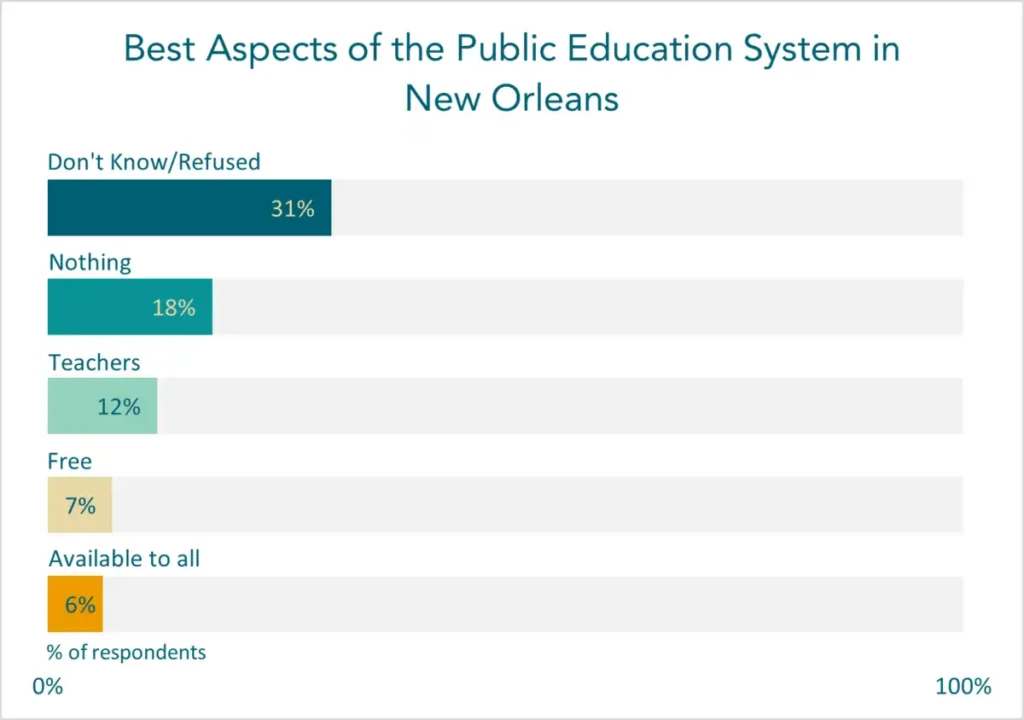
Best aspects
For the first time, this year, we asked NOLA-PS parents and guardians to tell what they believed was the best thing about public education in the city (this was a free response question). 31% of respondents did not provide an answer or refused to do so. For those who did respond, negative perceptions were once again apparent, as “Nothing” was stated by 18% of respondents. “Teachers” (12%), “Free” (7%), and “Available to all” (6%) were the next three most common answers.
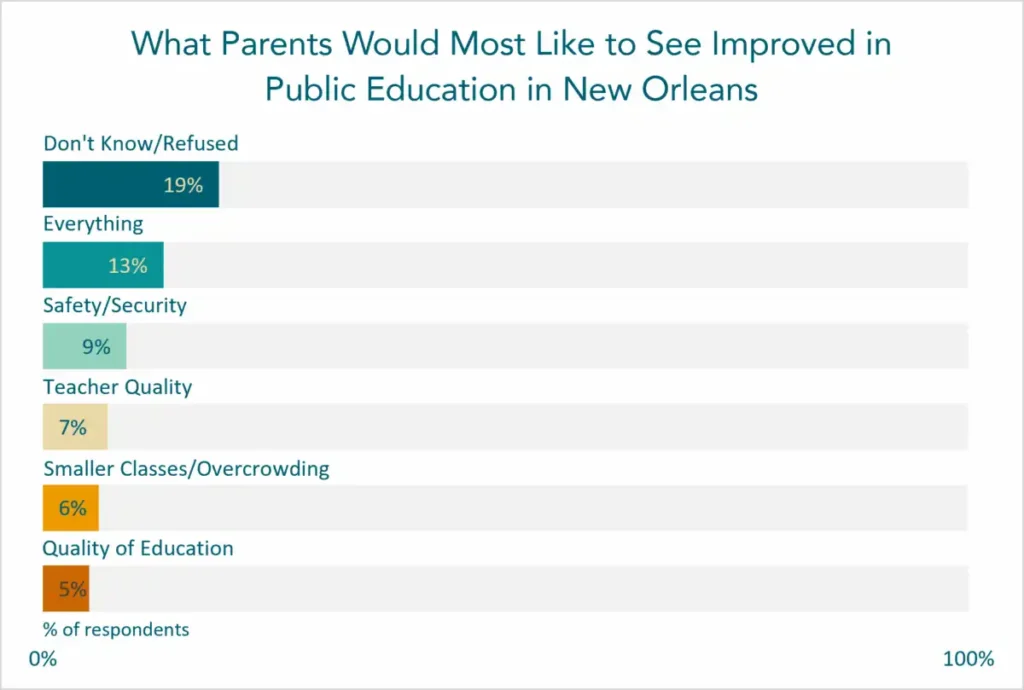
What can change
We also asked NOLA-PS parents and guardians what was the most important thing they believed should be improved about public education in New Orleans. Notably, 81% of respondents provided a suggestion (19% did not provide an answer or refused to do so). The most common answer, given by 13% of respondents, was “Everything”, followed by safety/security (9%), teacher quality (7%), smaller classes/reducing overcrowding (6%), and the overall quality of education (5%).
Conclusion
As mentioned earlier, this is the first of two briefs chronicling the results from the Cowen Institute’s polling for the 2023-2024 school year. The second brief will be released in February 2024. That brief will delve into more granular issues about education in the city. The results from those questions also illustrate higher levels of dissatisfaction with the direction of the city overall and public education in New Orleans specifically than our previous polls. That brief also will reinforce the finding from this brief that the experience of families with public education in the city varies greatly depending on their socioeconomic and education status, along with their race.
Brief 2: Parents and Guardians’ Opinions on K-12 Public Education in New Orleans
Overview
The Cowen Institute has conducted annual polls on perceptions of public education in New Orleans since 2007. Our polls are designed to provide insight into how parents, guardians, and the general public view New Orleans’ highly decentralized K-12 public education system. Each year, we ask some new questions about the most relevant and pressing issues facing educators and families. We also repeat questions from our previous polls to assess how opinions change over time on a few key topics. We now release the poll findings in a series of briefs at the start of each year. This is the second of two briefs that will be released in 2024 with results from polling conducted in the fall of 2023. We present the data in this way to make it more accessible and understandable for the general public — the briefs allow us to group the findings by topic, enabling us to surface trends about particular areas of the city’s education system. To capture the experiences and attitudes of a wide range of parents, as we have done since 2020, we polled 1,000 public and private school parents and guardians in Orleans Parish, as well as a small number who homeschool their children.
Methodology
This is the 14th opinion poll on public education in New Orleans published by the Cowen Institute since 2007. The survey items were developed by the Cowen Institute in consultation with LJR Custom Strategies, a strategic research and consulting firm led by Principal Jennifer Johnson. LJR has led our polling over the past six years. For this poll, LJR surveyed 1,000 adults who reside in Orleans Parish and are the parent/ guardian/responsible party for one or more children who currently reside in their household and attend a K-12 school or are homeschooled. The poll was conducted from October 1626, 2023, via landline and cell phone, with 90% of respondents reached by cell phone and 10% reached by landline. Findings applying to the 1,000 person sample are subject to a sampling error of plus or minus 3.1%; subgroups of the sample are subject to error of up to plus or minus 10%. Please note that when percentages in responses do not add up to 100%, it’s due to rounding.
Most Pressing Issues
We wanted to assess what parents and guardians felt was the most important issue that needed to be addressed in public education in New Orleans. We provided a list of options and asked them to choose what they believed was the most pressing issue. A plurality of respondents could not choose just one issue — 45% said that all the issues we provided were pressing. An additional 19% of respondents said “ensuring student safety and well-being” was the most pressing issue, followed by “improving academic outcomes”, “the number of students who live in poverty”, and “lack of diversity at high performing schools”, which all were cited by 6% of respondents. Broken down by race, 25% of Hispanic respondents identified student safety as the most pressing issue, compared to 21% of White respondents, and 16% of Black respondents. A majority of Black respondents, 50%, said all of the issues were the most pressing, compared to 44% of White respondents, and 27% of Hispanic respondents.
School Board
This year, New Orleans’ voters will have the opportunity to vote in NOLA-PS School Board elections (also referred to as OPSB). Among respondents, 75% said they were certain they would vote in the election and another 18% said they would probably vote, compared to just 2% who said they wouldn’t vote.
However, respondents seemed either unwilling to say whether they knew the Board member who currently represents their district or did not know the Board member — 92% said they did not know or refused to answer the question, compared to just 7% who named a school board member (we assessed whether they had named a current school board member, but not whether that member represented the district in which the respondent actually lived).
Subgroup Breakdown:
Perceptions of New Orleans’ education: Respondents who held more negative perceptions of the public education system in New Orleans were the most likely to say they were certain to vote in next year’s elections: 92% of those who gave the public education system a D or F grade said they would certainly vote, compared to 60% of those who gave the system a C, and 64% who gave it an A or B grade.
Race: Black and White respondents had similar rates of stating they would certainly vote (79% and 77%, respectively), while Hispanic respondents were far less likely to say they would vote (55% said they were certain and 38% said it was probable they would).
Age: The older the respondent, the more certain they said they would be to vote: 87% of respondents aged 55 or older said they were certain to vote, compared to 55% of respondents aged 18 to 34.
Income: Respondents across all income brackets expressed similar levels of certainty that they would vote (approximately 80% for all).
Common Application
New Orleans Public Schools has a unique application system called the New Orleans Common Application, also known as NCAP (NCAP has formerly been referred to as OneApp and EnrollNOLA). NOLA-PS has open enrollment, meaning that families can apply to and students can attend almost any school in the city. NCAP is the system by which parents and families apply to NOLA-PS schools — participants rank their choices and the district then assigns students to a school based on an algorithm that factors in such considerations as whether a sibling attends the school as well and how close the family lives to the school, amongst other indicators. Over the past several polls, we have assessed parents and guardians’ satisfaction with the NCAP process.
This year, we found that favorability towards NCAP dropped, echoing the negativity we saw in responses across the entire poll. While the percentage of respondents who had very or somewhat positive views of NCAP this year was similar to last year (25% to 22%), the percentage who had somewhat or very negative views of NCAP rose dramatically (42% in 2023 compared to 19% in 2022).
However, there is an important caveat with this data: The negative perceptions were largely driven by parents with a student in a NOLA-PS school who had not completed the NCAP process: 70% of such respondents had negative perceptions. Comparatively, among the parents and guardians who had filled out an NCAP, more had positive views than negative ones — 37% expressed somewhat or very positive views, compared to 27% who had somewhat or very negative ones.
Subgroup Breakdown
Multiple schools: Parents and guardians with children in multiple schools were more favorable toward NCAP than those with children in only one school: 38% of respondents with children in multiple NOLA-PS schools had very or somewhat positive views, compared to 29% with negative views; comparatively, 49% of respondents with a student in a single NOLA-PS school had negative views, compared to 21% who had positive ones.
Race: Black and White respondents had similarly negative views to NCAP (45% and 47% negative, respectively), but slightly more White respondents had positive views than Black respondents (27% positive to 18%, respectively); 41% of Hispanic respondents had positive views.
Income: Middle and lower income respondents were far more negative than those from wealthier households: 48% of lower income and 49% of middle income respondents had negative perceptions, compared to 27% of higher income respondents.

NCAP Experience
61% of the parents and guardians we surveyed with a student in a NOLA-PS school had completed the NCAP. 76% of parents and guardians of K-5 students had completed NCAP, which was far higher than parents and guardians of 6-8 (49%) and 9-12 (55%) grade students. Interestingly, higher income respondents had completed the NCAP at notably higher levels than middle and lower income respondents — 85% of higher income respondents had completed the NCAP, compared to 65% of middle income, and 47% of lower income respondents. Hispanic (92%) and White (67%) respondents were also more likely to have completed the NCAP than Black respondents (49%).
Notably, a majority of respondents, 51%, who completed the NCAP stated they were either very satisfied or satisfied with the schools where NCAP had placed their children, compared to 46% of respondents who stated they were dissatisfied or very dissatisfied with their placement. This was a shift from last year, when just 38% of parents expressed satisfaction and 54% expressed dissatisfaction. However, just 30% of respondents agreed or strongly agreed with the statement that “NCAP is easy to use”, compared to 45% who disagreed or strongly disagreed — last year, 31% expressed agreement and 64% expressed disagreement. It should be noted however, respondents who had actually completed NCAP were more likely to say that NCAP was easy to use, with 45% agreeing with the statement (51% disagreed), while only 6% of respondents who had not completed NCAP thought it was easy to use.
Subgroup Breakdown
Income: Wealthier respondents had the lowest satisfaction rates of all income brackets, with 67% expressing dissatisfaction with their placement, compared to 50% of all other respondents.
Race: White and Black respondents had similar response rates, with around 50% expressing satisfaction and 50% expressing dissatisfaction. Hispanic respondents had slightly higher rates of dissatisfaction, at 53%.

Specific issues
We also asked parents and guardians how concerned they were about certain issues impacting K-12 public education in the city currently. Notably, responses varied depending on the socio-economic status of the respondents.
IMPACT OF COMMUNITY VIOLENCE ON STUDENTS
93% of all respondents say the impact of community violence on students concerns them a lot. More than 90% of lower and middle income respondents expressed this concern, compared to 87% of higher income respondents. Crime was consistently stated as a top concern for respondents regardless of their race, with more than 90% of Black (95%), White (91%), and Hispanic (92%) respondents naming it as a concern. POVERTY This same gap between higher and lower income respondents appeared when we asked about their concern for the impact of poverty on education and students in the city. Overall, 89% of all respondents said it was a major concern, but the percentage of respondents citing this concern dropped from 92% among those from lower income households to 84% among those from higher income households. 93% of Black respondents cited poverty as a concern compared to 85% of White respondents.
HIRING AND RETAINING QUALITY TEACHERS
Conversely, when it came to the issue of hiring and retaining quality teachers in the city, parents and guardians from higher income households were more likely to name this as a concern than those from lower income households. Overall, 64% of respondents stated hiring and keeping quality teachers was a concern for them. But 80% of higher income respondents said this was a concern, compared to 53% of lower-income respondents. Responses varied greatly along racial lines on this issue, with Hispanic respondents naming it as a concern most frequently, at 83%, compared to 70% of White and 54% of Black respondents.
DISTANCE CHILDREN TRAVEL TO SCHOOL
Parents and guardians of NOLA-PS students from higher income households were also more likely to cite the distance children travel to school as a major concern than parents and guardians from lower income households. Overall, 54% of respondents named this topic as a concern, but 61% of higher income respondents cited it, compared to 52% of middle and lower income respondents. A majority of both White (52%) and Black (51%) respondents named distance traveled to school as a concern, but it was a far larger concern for Hispanic respondents (73%).
IMPACT OF LOWER PUBLIC SCHOOL ENROLLMENT
Public school enrollment has been dropping in NOLA-PS schools over the past few years. We asked parents and guardians whether this concerned them. We found a large difference in how concerning respondents viewed the decreasing enrollment in public schools depending on their income. Just 39% of all respondents cited this as a concern. However, 56% of higher income respondents did so, which was far higher than the 34% of lower income respondents who named it as an issue. Only 36% of White and 35% of Black respondents viewed declining public school enrollment as a top concern, while 72% of Hispanic respondents cited it.
School composition
THE RACIAL AND ETHNIC BACKGROUND OF STUDENTS
A majority of parents and guardians (56%) stated that having a student population from a diverse racial and ethnic background at their child(ren)’s school was important. This was far more important for lower income respondents (72%) than the higher income respondents (55%) surveyed. (Note: This was a split formed question, meaning that the same respondents did not say they both want their children in diverse and shared race schools.) However, these results seemed to be directly contradicted by another question we asked. We questioned parents and guardians on whether it was important that their children attend a school where students mostly shared the same racial and ethnic background as their children. Overall, 48% of parents and guardians said this was important, but 65% of those from lower income households stated it was important to them (compared to just 7% of those from higher income households), which would seem to not align with the same respondents’ answers to the question of having a diverse student body. Black respondents were more likely to say both options were important, while White respondents were less likely to say either was important. However, a majority of both Black (65%) and White (51%) respondents stated that having students from a diverse racial and ethnic background was important.
THE SOCIOECONOMIC BACKGROUND OF STUDENTS
Compared to the importance of students attending a school with students from diverse racial and ethnic backgrounds, parents and guardians were far less likely to say it was important that their child(ren) attend a school with students from a diverse socioeconomic background. Just 39% of parents and guardians said it was important for their child to attend a school where students came from a range of socioeconomic backgrounds. A majority, 63%, of lower income respondents said it was important, compared to 45% of higher income respondents, and just 26% of middle income respondents. Black respondents were at least twice as likely as White respondents to say it was important to have students from a diverse socioeconomic background (53% to 27%).
THE RACIAL AND ETHNIC BACKGROUND OF TEACHERS
Interestingly, the race and ethnicity of teachers did not seem that important to parents and guardians. Just 18% of all parents and guardians stated that it was important for their children to attend a school where teachers came from a diverse racial and ethnic background. Notably, though, 52% of higher income respondents stated this was important to them. Only 16% of all respondents said that having most teachers share the race and ethnicity of their child was important. Once again, however, the percentage was higher for wealthier respondents, with 36% saying it was important to them, compared to 20% of lower income respondents. Responses did not vary greatly by race.


School selection
Given the open enrollment system in New Orleans, parents and guardians’ preferences in how their children are assigned to a school matters. We asked parents and guardians whether they would prefer if the district assigned their child to the school closest to their home, and could therefore avoid the school choice process. We found respondents liked this method of school selection, with 60% saying they agreed or strongly agreed with that statement, which aligned closely with the 69% who gave the same response last year. Comparatively, 30% of respondents said they disagreed or strongly disagreed with the statement, which was an increase from the 21% who said so in 2022.
Parents and guardians also want some say in where their children attend school. 95% of all respondents said they strongly agreed or agreed with the statement that “It is most important for me to have a say in which school my child attends, regardless of where it is located.” That mirrored the results from last year when 92% expressed agreement with the statement.
postsecondary
While there is a great deal of evidence showing that college graduates make more over the course of their lifetimes than those without a college degree, due to the increasing cost of college, and the high rate of student debt in the United States, we wanted to assess whether New Orleans parents and guardians still believed college or postsecondary education was worth the expense.
We found that a majority of parents and guardians are unsure if a college degree is worth the cost: 51% said they agreed or strongly agreed with the statement “given the cost of higher education, I’m not sure a college degree is worth it,” compared to 43% who disagreed or strongly disagreed with it. The more education a respondent had, the more likely they were to disagree with the statement: 57% of college graduates disagreed, while 36% agreed, compared to just 24% of those with a high school degree or less disagreed and 68% expressed agreement. White respondents were also far more likely to believe college was worth the cost, with 53% disagreeing with the statement and 42% agreeing, while in Black respondents, the ratio was flipped, with 64% agreeing that the cost of college made them unsure it was worth it, compared to 31% who disagreed. Similar gaps also existed between respondents based on income, with 56% of wealthier respondents disagreeing and 38% agreeing, while 27% of lower income respondents disagreed, and 68% agreed.
Career and tech
To ensure students have economic and employment opportunities after they graduate, schools and states, both locally and nationally, have placed an increasing emphasis on offering students career and technical education while they are in high school. We wanted to assess parents and guardians’ perception of career and technical education.
We found resounding support among parents and guardians for promoting career and technical education in high schools. A near universal 96% of respondents said that it was important or very important to offer career and technical course work in high school that leads to high paying jobs and 94% agreed that they would consider having their children pursue career or technical course work that leads to a good paying job while in high school. However, the fact that many schools already offer such courses is not as widely understood by parents and guardians — only 56% reported that they were currently aware of those types of offerings.
Support for offering career and technical course work was strongest amongst parents and guardians with the most negative perceptions of public education in the city (those who assigned a D or F grade) and those who were age 55 and older. Support was lowest amongst college graduates and respondents aged 18-34. Respondents from higher incomes households were also less likely to think it was important than respondents from lower income households.
Conclusion
This was the second of the two briefs we have published on our polling of parents’ and guardians’ perceptions of public education in New Orleans for this year. The first brief is also available on our website, coweninstitute.org.
The results highlighted in both briefs illustrate a key finding from our polling from previous years: namely, that the socioeconomic status and race of families impacts their experience with public education in the city. While this finding may seem self-evident, it also is a reminder that education reflects many of the existing challenges that New Orleans continues to face.
Additionally, the findings in this brief illustrate the importance of the upcoming NOLAPS School Board elections. Three-fourths of parents and guardians in the city intend to vote in the election, which could have a significant impact on the future direction of public education in New Orleans.
Finally, this year’s findings regarding career and technical education echoed those from previous Cowen institute polls on the topic. Parents and guardians, regardless of demographics, are highly supportive of career and technical education and would like their child(ren) to have the opportunity to pursue it while in high school.