
This report aims to answer the question of what young people in New Orleans are doing after high school by looking at their educational and employment pathways.
Introduction
The first few years after high school are often viewed as crucial, laying the groundwork for the rest of a young person’s life. Decisions made between the ages of 18-24 often guide further steps in a young person’s life and can influence their ability to establish a satisfying and financially sustaining career. With that in mind, this report aims to answer the question of what young people in New Orleans are doing after high school by looking at their educational and employment pathways.
Specifically, this report works to answer some key questions we often hear with regards to young people’s post-high-school lives: How many of New Orleans high school graduates continue their educational journeys and go to college, and when they do, for how long, and where? How many enter the workforce and find jobs? If they’re working, in what industries are they employed and are they making a true living wage? What are the best economic opportunities available in New Orleans and nationally right now, and what may be the best opportunities five or ten years in the future? What skills do they need to take advantage of those possibilities?
We hope that this report serves as a foundation for a broader discussion about these pivotal questions. While we have used some of the best economic and educational data sources available (see the methodology section for a full breakdown), no amount of data can ever construct a complete picture of the individual experiences of every young person in the city. But the data can offer us a strong baseline impression about the lives of New Orleans’ youth after high school from which we can draw important conclusions about how to better serve young people going forward.
Overview
In order for young people to make informed decisions about career pathways and the postsecondary education, it’s critical for families and educators to have access to data on the local economy, the national economy, and postsecondary education options.
The first few years after high school are often viewed as critical, laying the groundwork for the rest of a young person’s life. Decisions made between the ages of 18-24 can influence a number of life outcomes, including the ability to establish a satisfying and financially sustaining career. To that end, this site provides a descriptive overview of educational and employment data on young people in New Orleans, with a focus on their post-high school lives.
In order for young people to make informed decisions about career pathways and postsecondary education, it’s critical for families and educators to have access to data on the local economy, the national economy, and postsecondary education options. However, data on these topics often remains disconnected and decentralized. One goal of this site is to bring economic and educational data about New Orleans youth together in one place, to ease the burden of information-gathering for our families, educators, and practitioners.
One goal of this site is to bring economic and educational data about New Orleans youth together in one place.
Questions on postsecondary life can be difficult to answer and, at least in terms of New Orleans youth, have received less attention than issues related to K-12 education. There are a number of good reasons for this. One of these is due to data access and availability. While the city’s youth are enrolled in public K-12 schools, we have access to data on their academic performance, key demographics, and other mandated state and national indicators. This data, along with other school-based measures, enables us to craft a narrative about the academic performance of New Orleans’ youth in K-12 public schools.
But what happens next?
Having a more in-depth understanding of postsecondary outcomes among New Orleans youth can help educators, families, counselors, policy makers, and employers navigate the transitionary period from high school to whatever comes next.
We hope that this site serves as a foundation for a broader discussion about postsecondary success for the city’s youth. While we have used some of the best economic and educational data sources available (see the methodology section for a full breakdown), it is descriptive in nature and has limitations. No amount of data can ever construct a complete picture of the individual experiences of every young person in the city. But the available data can offer us a strong baseline impression about the lives of New Orleans’ youth after high school from which we can draw important conclusions about how to better serve young people going forward.
Methodology
In order for young people to make informed decisions about career pathways and the pursuit of postsecondary degrees and certifications, it’s critical for families and educators to have access to data on the local economy, the national economy, and postsecondary education options. However, data on these topics often remains disconnected and decentralized. One goal of this report is to provide economic and educational data on New Orleans youth in one place, to ease the burden of information-gathering for our families, educators, and practitioners.
Education Data
The education data presented in this report was sourced from a number of local, regional, and national datasets. Enrollment data on New Orleans public high schools and some college enrollment data was gathered from the Louisiana Department of Education (LDOE). College enrollment and persistence data is from the LDOE, the National Student Clearinghouse (NSC), and the Louisiana Board of Regents (BoR). The NSC data currently covers approximately 96% of colleges, both public and private, across the nation and includes enrollment and persistence data. However, the most recent NSC data we have on New Orleans students is from 2016. The BoR data only covers public in-state institutions, both two-year and four-year, and only includes enrollment data, not persistence data. Data on institutions of higher education was gathered from the U.S. Department of Education’s College Scorecard Dataset and the Integrated Postsecondary Education Data Systems (IPEDS).
There are a number of limitations to the existing sources of education data. First, many outcome measures in Louisiana are recorded at the school level. Of particular relevance to the current study is high school graduation, which is signified at the school level by exit code. Since schools in Louisiana are held accountable for high school graduation, they may misreport their data to inflate graduate rates. Furthermore, some manual audits using hard-to-verify exit codes have been unable to confirm school-level data (Harris & Larsen, 2018). Another limitation is with regard to college persistence data, specifically. On a national level, the National Center for Education Statistics (NCES) calculates a six-year bachelor’s degree college graduation rate, meaning that rates provided in 2018 would be for high school graduates and/or first-year college freshman in 2012. This is the only way to calculate persistence over time, but a lag of six years can feel dated for a school system marked by large degrees of recent change.
This leads us to the final note on the educational data. The unique structure of New Orleans’ public education system provides unique challenges when comparing school-level data over time. Over the past five years, the city has experienced dozens of school closures, school takeovers, and new school openings. Thus, when we look at a seemingly straightforward variable (e.g. college enrollment by high school), it becomes complicated by a number of contextual factors that have taken place behind the scenes. The reader will notice inconsistencies, changes, and modifications in school names, operators, and authorizers over time. We try to provide contextual information in every instance to clarify the data for the reader. However, we admittedly fall short of providing a truly holistic explanation of the wide range of changes that have occurred in New Orleans’ public education landscape over the past decade.
Additionally, it is important to keep in mind that the data in this report is descriptive and intended to provide straight-forward and digestible baseline data on New Orleans youth and their educational and economic outcomes. For a more robust analysis of the impact of education reforms on college persistence in New Orleans, see Harris and Larsen’s recent publication on the topic, What Effect Did the New Orleans School Reforms Have on Student Achievement, High School Graduation, and College Outcomes? (2018). For overall benchmark data on the hospitality and tourism industry in New Orleans specifically, see the Data Center’s 2018 report, Benchmarking New Orleans’ Tourism Economy: Hotel and Full-Service Restaurant Jobs.
Economic Data
All demographic and economic data in this report is sourced from Emsi, an analytics company that centralizes and analyzes national and regional datasets on the labor market, higher education, and demographic indicators. As Emsi gathers and aggregates data from a number of national datasets, there are some limitations in how we can access and organize this information. One area where this impacts our data is with age range. For example, some Emsi datasets allow analysis of age ranges from 14-18, while others are limited to 14-19. This is due to the different ways government agencies group age buckets. Census data uses the group of 15-19 whereas the Bureau of Labor and Statistics uses 14-18. While these technical issues can make direct comparisons more difficult, they are unavoidable limitations of the available data. A full list of Emsi’s datasets can be found here and a detailed explanation of their methodology can be found here. All economic data used in this report is from 2018.
When examining industries, we used Emsi’s definition of two-tier North American Industry Classification System (NAICS) codes. According to Emsi documentation, there are several key differences between Emsi and standard NAICS codes:
- Emsi combines all industry data under 111 (Crop Production) and 112 (Animal Production) into single detailed codes: 111000 and 112000, respectively. This is due to the paucity of detailed and complete agricultural employment data, as well as for compatibility with categories used in Input-Output modeling.
- Emsi uses a single code, 482110 (Rail Transportation), as an aggregate of NAICS 482111 and 482112.
- In Emsi data, 491110 (Postal Service) represents private-sector United States Postal Service (USPS) contractors only. Actual USPS establishments are found in Emsi code 901149.
- Emsi does not have data for 541120 (Offices of Notaries), because the BLS does not report any data for that category.
- Emsi creates a separate hierarchy for public-sector establishments under code 90 (Government), as explained below.
Demographics of New Orleans
In order to provide context for the economic and educational data offered in this report, it’s first important to establish some facts about the demographic makeup of New Orleans’ residents as a whole.
As of 2018, young people aged 15-24 accounted for nearly 12% of New Orleans’ population of more than 400,000 people.
The total population of Orleans Parish grew to 400,106 people, an increase of 2%, from 2017 to 2018. As of 2018, youth aged 15-24 accounted for nearly 12% of the entire population. This age cohort includes a greater proportion of individuals who are Black than the city’s population as a whole.
66.5%Black
22.6%White
4.0%Hispanic
3.5%Asian
Overall, 59.0% of the city’s population was Black, while 30.8% was White, 4.2% was Hispanic, and 3.0% was Asian; 52.6% of the city’s residents are female and 47.4% are male.
51.2%Female
48.8%Male
As of 2017, a greater percentage (35%) of residents had at least a bachelor’s degree or additional college degree than the rest of Louisiana (23%) or the United States (30%) as a whole. New Orleans also had a smaller percentage of its population with a high school diploma or less, at 39%, compared to 50% for Louisiana, and 42% for the U.S. However, large inequities in educational attainment are visible along the lines of race: 67.4% of the White population holds at least a bachelor’s degree, compared to 22.6% of Black residents.
Using labor and economic data from Emsi, an industry leading firm in economic data analysis, this section offers an overview of the economy in New Orleans compared to the greater metro area, all of Louisiana, and the United States. We include data that focuses specifically on how New Orleans’ youth, aged 14-24, currently fit into that economy, including the most common industries and occupations for youth to be employed.
Economic Opportunities
The Economy By Industry
Accommodation and food services is the largest industry in Orleans Parish, employing more than 40,000 people. That is more than twice the number that would be expected for a city of New Orleans’ size.
New Orleans’ economy is highly reliant on the hospitality and tourism industry, most specifically the accommodation and food services sector. Accommodation and food services (which serves a large number of local patrons as well as tourists) is the largest employment sector in Orleans Parish, employing more than 40,000 people. That is more than twice the number that would be expected for a city of New Orleans’ size. The only industry more disproportionately overrepresented in New Orleans is educational services, which has 3.83 times more jobs than what would be expected based on national trends for a city of New Orleans’ size and demographics. Accommodation and food services is also the industry with the largest growth in terms of absolute jobs, followed by healthcare and social assistance.
New Orleans’ prominent industries pose some challenges for the city’s overall economy: based on Emsi analysis of the 20 largest industries in the city, accommodation and food services has the lowest median annual earnings per worker, at just $31,326, including tips. It is important to note that these earnings also include part-time employees, so the earnings of full-time employees could be higher.
Overall, while the local economy does offer some well-paying jobs, as a whole, there are far more jobs available that pay low wages — especially for those without a postsecondary credential.
The 2017 median household income in Orleans Parish is $38,700, which is $19,000 less than the national median of $57,700.

Young people aged 14-24 account for 12.4% of the city’s workforce.

Where Do Young People Work? A Closer Look at Occupations by Industry
For youth, when it comes to a diverse set of industries offering mid- to high-paying jobs, the economy in New Orleans and the greater metro area is relatively limited when compared to the rest of the United States. While government is a large employer with reasonably well-paying jobs, this chart again shows the significant overrepresentation of youth in the accommodation and food services industry broken down by occupation. While this industry employs many people, its median salary typically does not meet living wage standards for an adult with any dependents. For context, according to MIT’s living wage calculator, in New Orleans, for one adult with one child, the living wage would be $24.37 an hour, or $50,684 annually.

Unsurprisingly, given the total number of people employed, these industries include many youth among their workers. For instance, in the city of New Orleans, over half, 51.9%, of all those employed in accommodation and food services are between the ages of 14-34, with 16.5% of workers in the industry aged 19-24. Many of these jobs are in restaurants.
Regionally, statewide, and nationally, the accommodation and food services sector is also the largest employer of youth. However, many of the industries with better paying jobs, such as construction, employ fewer youth in New Orleans compared to outside of the city. For youth with the ability to travel outside of the city, health care and social assistance employs a relatively large number of youth in the region, and across the nation, and includes many opportunities for those without advanced credentials (though the highest paying jobs in the industry do require postsecondary credentials).
Based on the data available, we’re unable to differentiate how many of those employed in the industry are permanent residents and how many may seasonal residents, such as students attending one of the region’s four-year universities.
Industry Growth
New Orleans does have some higher paying industries but of the ten highest paying industries in the city, only two employ more than 10,000 people: government and professional, scientific, and technical services. Additionally, eight of those ten industries experienced job growth of 1% or less over the past year.
When considering the best career prospects for local youth in New Orleans it is worth looking at the industries with the greatest current and projected job growth in the city. Unfortunately, the data on job growth once again presents a somewhat mixed view. Over the past five years, accommodation and food services is the industry with the largest job growth in terms of absolute jobs available. Additionally, of the top ten fastest growing industries in the city over that time, only one has an average salary of over $100,000, and half of the top ten have average earnings of less than $50,000.
When looking at the industries with the greatest amount of projected job growth over the next five years (from 2018 to 2023), the story is much the same, with accommodation and food services remaining as the largest employer, as well as the industry with the greatest anticipated growth.
None of the top ten projected industries in terms of job growth have median earnings over $100,000 a year, and three of the top five have median earnings of less than $50,000.
https://public.tableau.com/views/GrowthOverTime/IndustryGrowthinNO?:embed=y&:showVizHome=no&:host_url=https%3A%2F%2Fpublic.tableau.com%2F&:embed_code_version=3&:tabs=no&:toolbar=yes&:animate_transition=yes&:display_static_image=no&:display_spinner=no&:display_overlay=yes&:display_count=yes&publish=yes&:loadOrderID=3
When looking at the industries with the largest projected job growth over the next five years (from 2018 to 2023), it is predicted that accommodation and food services will remains the largest industry. None of the top ten projected industries in terms of job growth have median earnings over $100,000 a year, and three of the top five have median earnings of less than $50,000.
Notes
Sources for the data used on this page for both text and the charts include:
- Emsi, “Economy Overview” analysis report for Orleans Parish for 2018.
- Emsi, industry tables for Orleans Parish, Greater New Orleans region, and the United States for 2018.
- Emsi, Occupational Data for Orleans Parish for 2018.
- Emsi, Occupational Data for the United States for 2018.
- Emsi, Job Posting Data for Orleans Parish and the New Orleans MSA for 2018.
- Emsi, Occupational Data for Orleans Parish for 2018.
Postsecondary Education
Education Overview
As the data in this section focuses on the postsecondary outcomes of New Orleans public high school students, it’s important to understand some basic demographic information about these students and the context of their school system. New Orleans’ public education system often receives national attention due to its unique governance model, being the only public school system in the country comprised almost exclusively of charter schools.
As of October 2018, New Orleans’ 86 public schools were serving 50,451 PK-12 students. The majority of New Orleans public school students are students of color (91.4%), most of whom are Black (78.5%). As is common in other urban districts, most of the city’s students are from low-income backgrounds (81.1%). Enrollment in the system follows a school choice model and no students are assigned to neighborhood schools according to geographic catchment zones. Despite citywide open enrollment policies, inequities persist along racial and economic lines.
College Enrollment
Given the uniqueness of the governance model, New Orleans schools’ measurable outcomes are closely watched by education reformers, policymakers, researchers, and community advocates. As has been widely discussed, academic performance and high school graduation rates in New Orleans saw an increase over the past decade but have stagnated in recent years. The 2017 cohort graduation rate for public school students in the city was 72.8%, with a growth rate of 0.1% from 2013-14 to 2016-17. This is well below the average cohort graduation rate for the state of Louisiana (78.1%), as well as the statewide growth rate (3.5%). A similar trend has been seen with ACT scores.
Nevertheless, college enrollment among students from New Orleans public high schools has increased over time. In 2017, an estimated 61% of New Orleans public high school students enrolled in college. This is an approximate 4% increase over a five year period. While there are a number of contextual factors that make it difficult to compare current educational outcomes to those pre-Katrina, the increase in college-going is particularly visible when we compare with 2004 rates. While the current report aims only to provide descriptive baseline data on college-going, recent research has taken a more in-depth approach to understanding the factors influencing this change in college outcomes among New Orleans graduates.
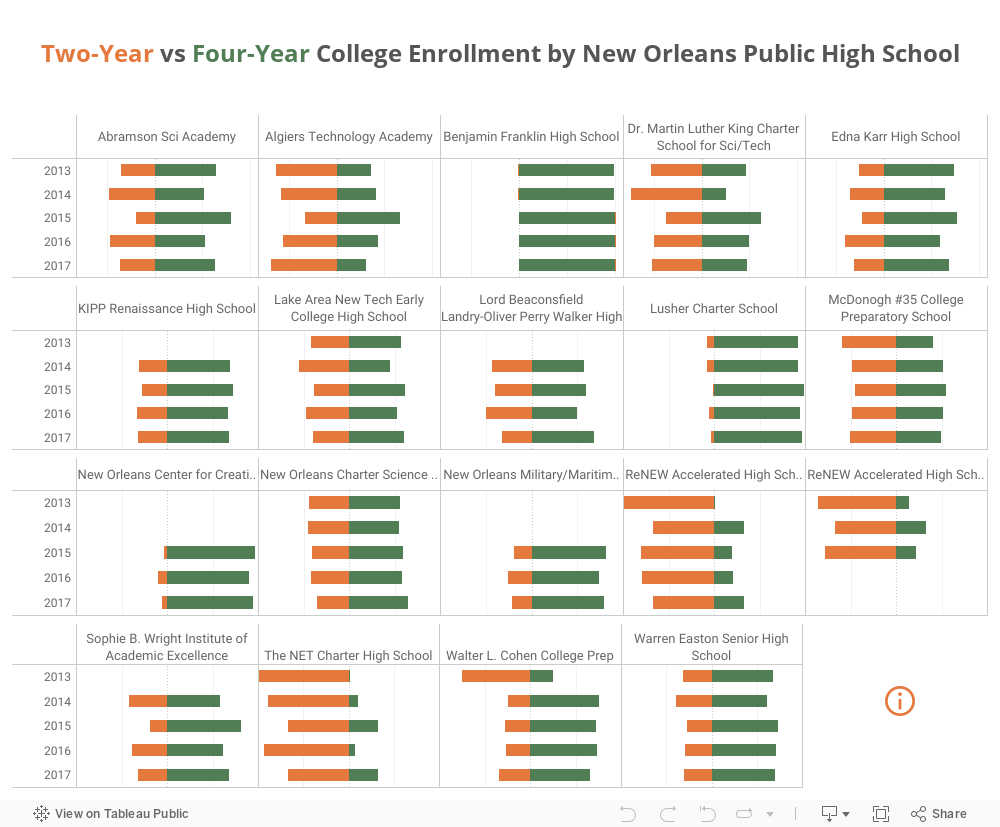
However, while there appears to be a trend of increased college enrollment across the city, there are differences along racial and socioeconomic lines. While 83% of white public school students enrolled in postsecondary education after high school graduation, 59% of Black public school students did the same. As with previous data, this varied greatly by school, as demonstrated in the graphic below.

29%attend two-year institutions
71%attend four-year institutions
The vast majority of New Orleans’ college-goers attend schools in the state (77%) or in the city (65%). Among recent New Orleans high school students who enrolled in college, the largest percentage enrolled in Delgado Community College (22%), followed by University of New Orleans (12%), Southern University New Orleans (11%), and Xavier University (9%). Combined with students who enrolled in Dillard (6%), Loyola (3%), and Tulane (2%), nearly two thirds of recent New Orleans public high school graduates enrolled in colleges in the city. Of the 23% of public high school graduates who enrolled in colleges out of state, the largest percentage attend schools in the neighboring states of Mississippi (18%)and Texas (16%).
77%attend schools in Louisiana
65%attend schools in New Orleans
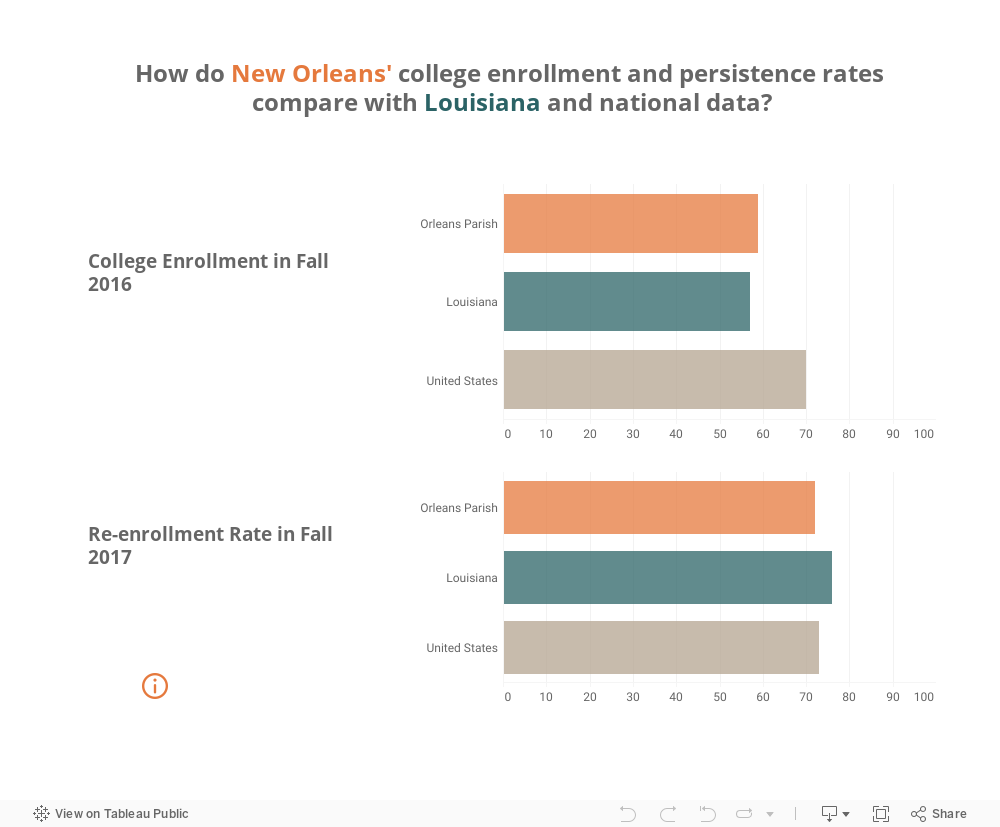
College Persistence
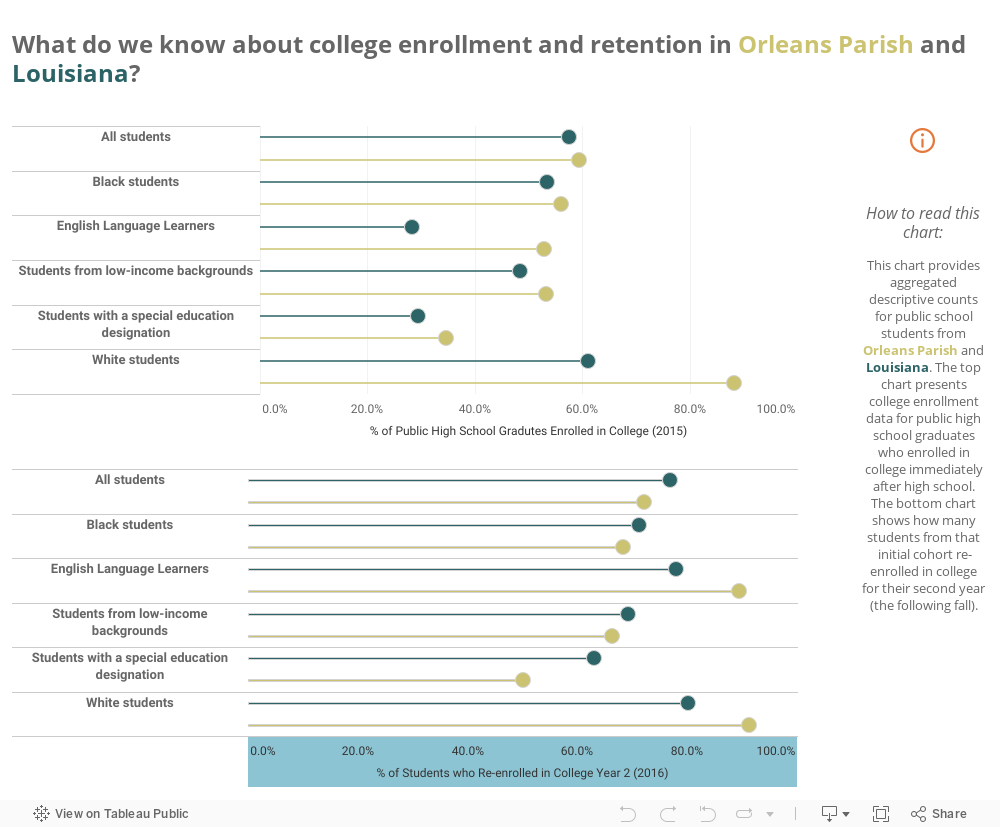
Mirroring national trends, New Orleans data reveals inequities in college persistence rates along the lines of race and socioeconomic status. Of the graduating high school class of 2016, 59.6% of New Orleans public school graduates enrolled in college the fall after their senior year, which was slightly higher than the state average of 57.5%. Of that initial cohort of college-goers, 72.1% remained enrolled in college in the fall of 2017. This is in line with the national second-year college re-enrollment rate of 73.4% and translates to approximately 44% of New Orleans public high school graduates. However, the second year re-enrollment rate varied dramatically along the lines of race: 91.2% of white students returned to college in the fall of their second year, compared to 68.3% of Black students. Approximately one third (33.7%) of economically disadvantaged students and half (50.0%) of students with a special education designation did not return to college in the fall the year after enrolling. Among all three populations (students from low-income backgrounds, special education students, and Black students), New Orleans youth persisted at a slightly lower rate than comparable groups at the state and national levels.
Persistence at the State Level
On the state level, there are discrepancies in persistence and completion rates between students at two-year and four-year institutions. Of first-time, full-time degree seeking students in the freshman class of 2011 who attended a four-year institution, 51.5% completed their degree within 150% of the allotted time (six years). However, only 18.2% of the same cohort seeking a two-year degree completed in 150% of the allotted time. There has been an improvement in the total number of completions among students in public technical or community colleges across the state over the past four years but the rate, 21.4%, remains notably lower than the persistence and completion rate of those students in public, in-state four-year institutions.
Anecdotally, there is discussion of students who start college at a two-year college and then transfer to a four-year college or university to earn a bachelor’s degree. However, Board of Regents data shows that this pathway is actually uncommon in our public, in-state colleges and universities. Only 12.1% of Louisiana students from the high school class of 2011 who started in a two-year institution earned any undergraduate degree in the six years following matriculation. Of first-time students who start at Delgado Community College, the postsecondary institution where the most New Orleans public school students matriculate, only 5.4% completed any undergraduate degree within six years.
Only 12.1% of Louisiana students from the high school class of 2011 who started in a two-year institution earned any undergraduate degree in the six years following matriculation.
Contextual Factors Impacting Postsecondary Education in Louisiana
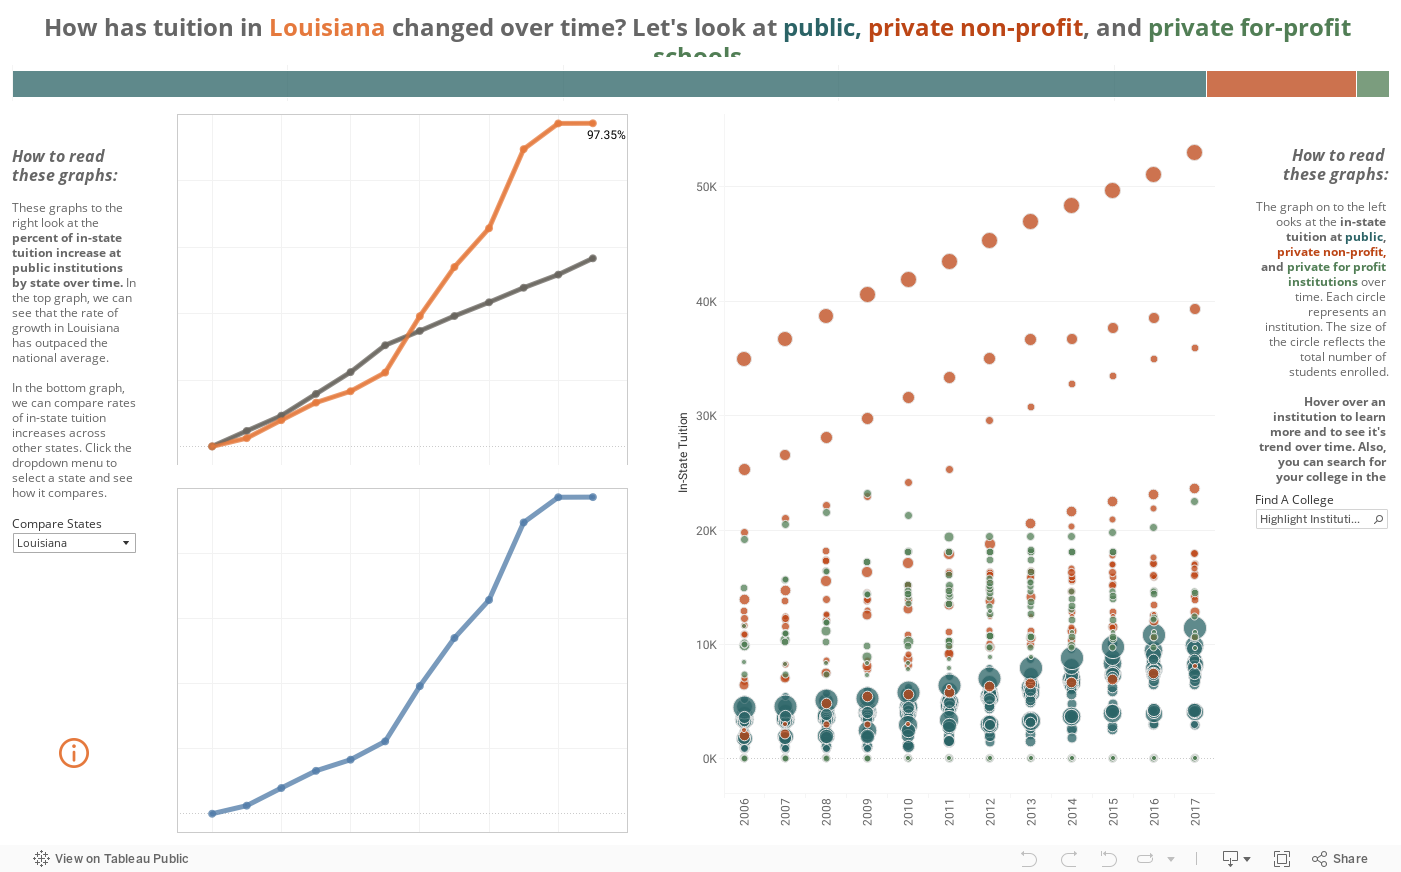
When discussing postsecondary education in New Orleans, it’s important to consider the range of local, regional, and contextual factors that may impact college-going and college persistence. Of importance is the fact that the cost of postsecondary education in the state of Louisiana has been steadily increasing. While this is true of public and private higher education institutions across the country, the rate of increase in Louisiana has outpaced many other states.
Higher performing students, specifically those who have at least a 2.5 GPA and an 18 (TOPS Tech) or 20 (TOPS) ACT score, are eligible for TOPS, a statewide scholarship. A TOPS award covers tuition at public institutions across the state, or the award can be used to cover some of the tuition at private institutions. Students with higher academic performance are eligible for additional funding through TOPS for supplies and additional fees, which can often be prohibitively expensive for low-income students. The relationship between higher education funding and the TOPS scholarship has grown complicated in recent years. As tuition rates increase to account for the reduction in allocated higher ed funds, the amount that the state pays in TOPS scholarships has subsequently increased. Over the past several legislative sessions, TOPS has been a topic of discussion and debate as policymakers weigh the feasibility of the program in the face of increasing budgetary shortfalls. For now, TOPS remains intact, but the long-term stability of the program is in question.
Another important contextual factor influencing postsecondary education and access in Louisiana is related to the FAFSA. Starting in 2017-2018, all Louisiana high school seniors are required to complete the FAFSA (or a waiver) in order to graduate. This policy aims to increase students’ access to federal higher education funds and ultimately, their access to postsecondary education. In June 2018, Louisiana led the nation in FAFSA completion rates.
Explore the Data
In this section, you can explore the data in greater depth. We have all downloadable datasets available here and all interactive graphics are featured below.
Economic Data


Education Data


